

Identification of TTP mRNA targets in human dendritic cells reveals TTP as a critical regulator of dendritic cell maturation
- PMID: 18367721
- PMCID: PMC2327351
- DOI: 10.1261/rna.748408
Identification of TTP mRNA targets in human dendritic cells reveals TTP as a critical regulator of dendritic cell maturation
Abstract
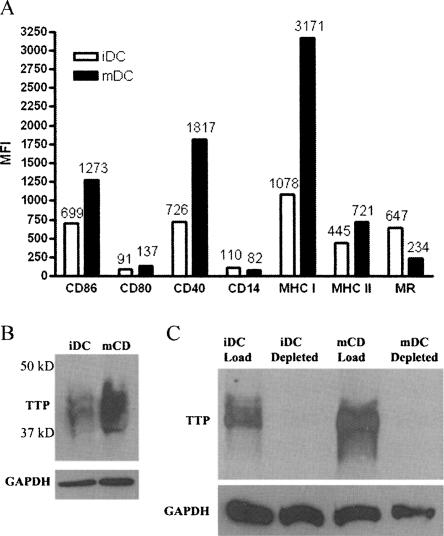
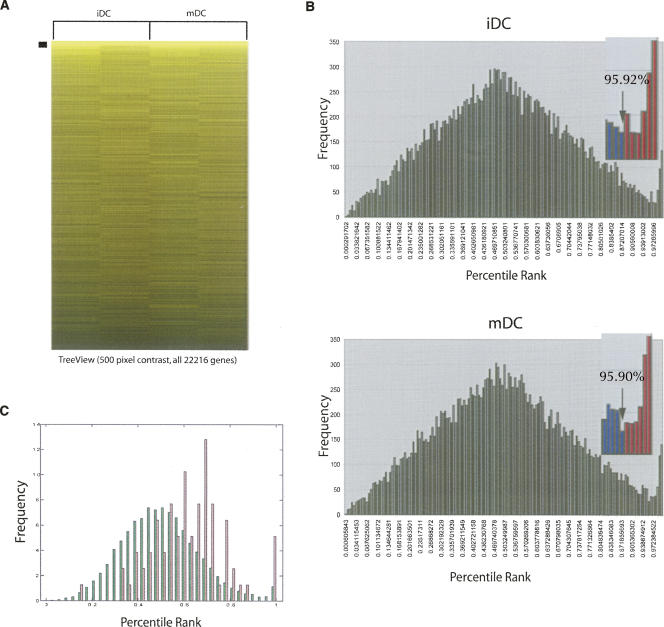
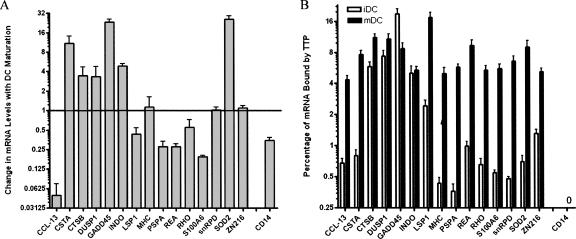
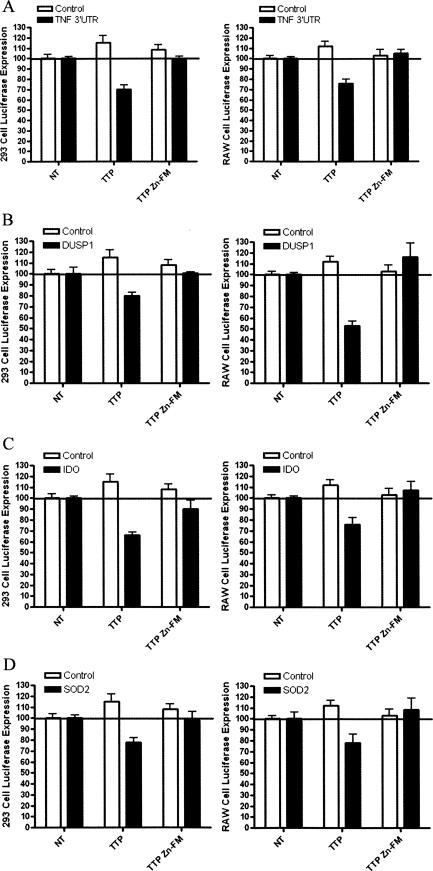
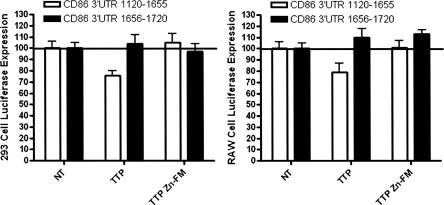
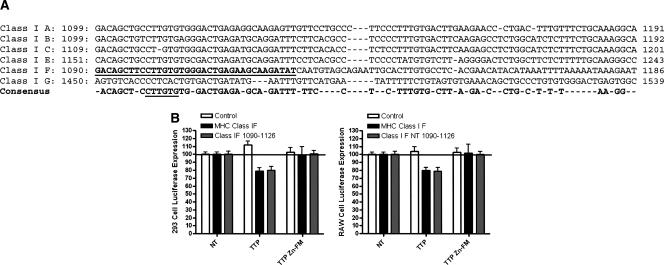
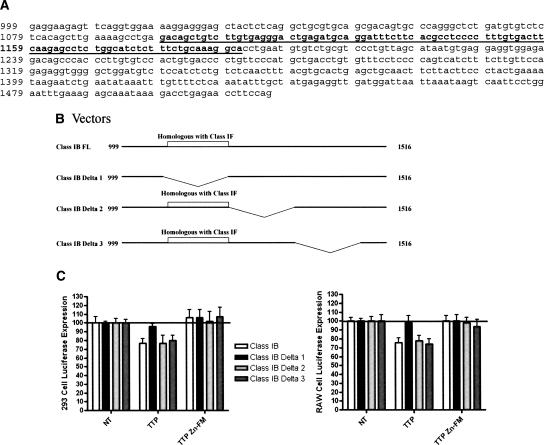
Dendritic cells provide a critical link between innate and adaptive immunity and are essential to prime a naive T-cell response. The transition from immature dendritic cells to mature dendritic cells involves numerous changes in gene expression; however, the role of post-transcriptional changes in this process has been largely ignored. Tristetraprolin is an AU-rich element mRNA-binding protein that has been shown to regulate the stability of a number of cytokines and chemokines of mRNAs. Using TTP immunoprecipitations and Affymetrix GeneChips, we identified 393 messages as putative TTP mRNA targets in human dendritic cells. Gene ontology analysis revealed that approximately 25% of the identified mRNAs are associated with protein synthesis. We also identified six MHC Class I alleles, five MHC Class II alleles, seven chemokine and chemokine receptor genes, indoleamine 2,3 dioxygenase, and CD86 as putative TTP ligands. Real-time PCR was used to validate the GeneChip data for 15 putative target genes and functional studies performed for six target genes. These data establish that TTP regulates the expression of DUSP1, IDO, SOD2, CD86, and MHC Class I-B and F via the 3'-untranslated region of each gene. A novel finding is the demonstration that TTP can interact with and regulate the expression of non-AU-rich element-containing messages. The data implicate TTP as having a broader role in regulating and limiting the immune response than previously suspected.
Figures
Similar articles
-
The role of tristetraprolin in cancer and inflammation.Front Biosci (Landmark Ed). 2012 Jan 1;17(1):174-88. doi: 10.2741/3920. Front Biosci (Landmark Ed). 2012. PMID: 22201737 Free PMC article. Review.
-
The RNA binding protein tristetraprolin influences the activation state of murine dendritic cells.Mol Immunol. 2010 Feb;47(5):1161-70. doi: 10.1016/j.molimm.2009.11.002. Epub 2009 Nov 28. Mol Immunol. 2010. PMID: 19945750
-
Coordinated expression of tristetraprolin post-transcriptionally attenuates mitogenic induction of the oncogenic Ser/Thr kinase Pim-1.PLoS One. 2012;7(3):e33194. doi: 10.1371/journal.pone.0033194. Epub 2012 Mar 8. PLoS One. 2012. PMID: 22413002 Free PMC article.
-
Tristetraprolin-RNA interaction map reveals a novel TTP-RelB regulatory network for innate immunity gene expression.Mol Immunol. 2020 May;121:59-71. doi: 10.1016/j.molimm.2020.02.004. Epub 2020 Mar 9. Mol Immunol. 2020. PMID: 32163759
-
Tristetraprolin (TTP): interactions with mRNA and proteins, and current thoughts on mechanisms of action.Biochim Biophys Acta. 2013 Jun-Jul;1829(6-7):666-79. doi: 10.1016/j.bbagrm.2013.02.003. Epub 2013 Feb 18. Biochim Biophys Acta. 2013. PMID: 23428348 Free PMC article. Review.
Cited by
-
TTP-mediated regulation of mRNA stability in immune cells contributes to adaptive immunity, immune tolerance and clinical applications.RNA Biol. 2021 Dec;18(12):2150-2156. doi: 10.1080/15476286.2021.1917185. Epub 2021 Apr 27. RNA Biol. 2021. PMID: 33866923 Free PMC article. Review.
-
Beta Interferon Production Is Regulated by p38 Mitogen-Activated Protein Kinase in Macrophages via both MSK1/2- and Tristetraprolin-Dependent Pathways.Mol Cell Biol. 2016 Dec 19;37(1):e00454-16. doi: 10.1128/MCB.00454-16. Print 2017 Jan 1. Mol Cell Biol. 2016. PMID: 27795299 Free PMC article.
-
The role of tristetraprolin in cancer and inflammation.Front Biosci (Landmark Ed). 2012 Jan 1;17(1):174-88. doi: 10.2741/3920. Front Biosci (Landmark Ed). 2012. PMID: 22201737 Free PMC article. Review.
-
Diversity and specificity of the mitogen-activated protein kinase phosphatase-1 functions.Cell Mol Life Sci. 2013 Jan;70(2):223-37. doi: 10.1007/s00018-012-1041-2. Epub 2012 Jun 14. Cell Mol Life Sci. 2013. PMID: 22695679 Free PMC article. Review.
-
Differential expression and functional analysis of the tristetraprolin family during early differentiation of 3T3-L1 preadipocytes.Int J Biol Sci. 2012;8(5):761-77. doi: 10.7150/ijbs.4036. Epub 2012 May 31. Int J Biol Sci. 2012. PMID: 22701344 Free PMC article.
References
-
- Allantaz, F., Chaussabel, D., Stichweh, D., Bennett, L., Allman, W., Mejias, A., Ardura, M., Chung, W., Wise, C., Palucka, K., et al. Blood leukocyte microarrays to diagnose systemic onset juvenile idiopathic arthritis and follow the response to IL-1 blockade. J. Exp. Med. 2007;204:2131–2144. - PMC - PubMed
-
- Altschul, S.F., Gish, W., Miller, W., Myers, E.W., Lipman, D.J. Basic local alignment search tool. J. Mol. Biol. 1990;215:403–410. - PubMed
Publication types
MeSH terms
Substances
Grants and funding
LinkOut - more resources
Full Text Sources
Molecular Biology Databases
Research Materials
Miscellaneous