. 2008 Jun;82(11):5279-94.
doi: 10.1128/JVI.02631-07. Epub 2008 Mar 26.

Proteomics analysis unravels the functional repertoire of coronavirus nonstructural protein 3

Affiliations

Proteomics analysis unravels the functional repertoire of coronavirus nonstructural protein 3

Benjamin W Neuman et al. J Virol. 2008 Jun.

Abstract

Severe acute respiratory syndrome (SARS) coronavirus infection and growth are dependent on initiating signaling and enzyme actions upon viral entry into the host cell. Proteins packaged during virus assembly may subsequently form the first line of attack and host manipulation upon infection. A complete characterization of virion components is therefore important to understanding the dynamics of early stages of infection. Mass spectrometry and kinase profiling techniques identified nearly 200 incorporated host and viral proteins. We used published interaction data to identify hubs of connectivity with potential significance for virion formation. Surprisingly, the hub with the most potential connections was not the viral M protein but the nonstructural protein 3 (nsp3), which is one of the novel virion components identified by mass spectrometry. Based on new experimental data and a bioinformatics analysis across the Coronaviridae, we propose a higher-resolution functional domain architecture for nsp3 that determines the interaction capacity of this protein. Using recombinant protein domains expressed in Escherichia coli, we identified two additional RNA-binding domains of nsp3. One of these domains is located within the previously described SARS-unique domain, and there is a nucleic acid chaperone-like domain located immediately downstream of the papain-like proteinase domain. We also identified a novel cysteine-coordinated metal ion-binding domain. Analyses of interdomain interactions and provisional functional annotation of the remaining, so-far-uncharacterized domains are presented. Overall, the ensemble of data surveyed here paint a more complete picture of nsp3 as a conserved component of the viral protein processing machinery, which is intimately associated with viral RNA in its role as a virion component.


Figures

FIG. 1.
FIG. 1.
Interaction map for SARS-CoV-derived components. Double outlines indicate major components, including known high-copy-number virion proteins and the large viral RNA genome, and minor components, including low-copy-number and weakly conserved proteins. Black outlines identify components detected by mass spectrometry proteomics. Gray outlines indicate components identified in other published studies. Solid single outlines denote novel components identified in both native and PK SARS-CoV.
FIG. 2.
FIG. 2.
Overview of nsp3 organization. (A) Multiple sequence alignment of coronavirus and torovirus nsp3 homologs. The 16-component functional annotation presented here (Func) is an extension of our previous SARS-CoV-specific domain boundary prediction (SARS) and the ongoing analysis by Gorbalenya and collaborators (Gorb). It incorporates domain boundaries defined in a hierarchy of functional (f), structural (s), and phylogenetic (p) criteria. The functional annotation was compiled from published data and results presented here. Region designations include the following: ubiquitin-related domains (UB1 and UB2), an acidic hypervariable region (AC), complete (PL1pro and PL2pro) or partial (pro) papain-like cysteine proteinases, ADRP, a SARS-CoV subgroup-specific MBD, the carboxyl-terminal moiety of the “SARS-unique domain” (SUD-C), group II-specific NAB domain and marker domain (G2M), two predicted double-pass transmembrane domains (TM1-2 and TM3-4), a putative metal-binding region (ZF), and three subdomains forming part of the Y region (Y1 to Y3) originally described by Gorbalenya et al. (18). Dotted lines denote additional subgroup-specific domains not included in the annotation above. Amino acid residues are color coded gray (AFGILMPVWY), light blue (KNQRST), blue (CH), or red (DE) to highlight patterns that may mark conserved protein structures. We divide group II into four subgroups following published suggestions (71) and divide group I into two subgroups. Sequences from equine and bovine toroviruses are shown from the domain homologous to ADRP onward. (B) Selected SARS-CoV expression constructs. Solid lines denote expression (also Table 1); dashed lines indicate that no expression has so far been obtained. (C) Enlargement of the ZF and flanking regions, with transmembrane domain predictions. The overlay shows the average transmembrane probability score for 400-amino-acid regions centered on the first conserved cysteine of ZF. A red overlay displays average transmembrane probability scores calculated by TMHMM2 for this region from a set of 15 representative coronaviruses, approximately equally weighted with respect to each subgroup (see Materials and Methods). For display purposes, in this panel the sequences are aligned only with conserved clusters of four cysteine/histidine residues in ZF and Y1 (α and β). (D) Structural annotation of SARS-CoV nsp3. Experimentally characterized flexibly disordered regions are indicated with dashed green lines, and predicted flexible regions separating conserved domains are indicated with solid green lines.
FIG. 3.
FIG. 3.
Oligomerization of SARS-CoV nsp3 domains. (A) PFO-PAGE analysis reveals the oligomeric state of selected nsp3 domains in solution. A Benchmark protein ladder (M) was used to estimate protein and protein complex molecular masses, indicated in kDa at left. Lanes in panel A contain, from left to right, 25 μM, 50 μM, and 100 μM nsp2, ADRP, and SUD; 25 μM and 50 μM UB2-PL2pro; and 50 μM and 100 μM NAB, respectively. (B) Reducing sodium dodecyl sulfate-PAGE analysis of selected nsp3 domains. Lanes in panel B contain, from left to right, 50 μM and 100 μM nsp2, NAB, SUD, ADRP, and UB1, respectively.
FIG. 4.
FIG. 4.
PFO-PAGE analysis of interdomain oligomerization. Approximately equimolar concentrations of bacterially expressed nsp3 domains were incubated separately (left) or in combination (right) at 37°C for 1 h and analyzed by PFO-PAGE. The panel at left demonstrates the electrophoretic mobility of each protein species and homooligomer; lanes at left contain 2 and 1 nanomole of UB1, ADRP, or SUD or 10 and 5 nanomoles NAB, respectively. Each lane at right depicts mixtures of 2 nanomoles of UB1, ADRP, or SUD and 5 nanomoles NAB as shown. Proteins were visualized with SYPRO-ruby staining. Marked bands correspond to 50-kDa and 110-kDa UB1+SUD complexes (filled triangles) and 60-kDa ADRP+SUD complexes (open triangles). In the presence of additional nsp3 domains, UB1+SUD complexes are not formed, but the amount of ADRP+SUD complex is increased. Duplicate samples are shown for the four-domain mixture. Lanes containing the Benchmark protein ladder are indicated (M), with masses in kilodaltons indicated at left.
FIG. 5.
FIG. 5.
Titration of cobalt binding by 10 μM SUD and SUD-C. UV-visible spectra of 10 μM full-length SUD (A to C), SUD-C (D and E), and truncated SUD451-651 (F) solutions were measured after addition of 0 to 5 molar equivalents of Co(II) in the form of CoCl2. Relative Co(II) concentration is indicated with colored lines running from red (0 equivalents) to violet (5 equivalents). Because of the observed metal ion concentration-dependent protein precipitation during these experiments, both the raw absorbance at 310 nm (A310; panels B, C, E, and F; black circles) and normalized absorbance (A310/A250; open circles) are plotted. (C) Displacement of Co(II) by Zn(II) was investigated by addition of ZnCl2 to 10 μM SUD solutions that had been previously saturated with 5 equivalents of Co(II).
FIG. 6.
FIG. 6.
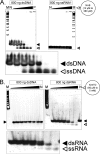
Generic nucleic acid binding properties of SUD-C, SUD, and NAB domains of nsp3. (A) EMSAs were performed with sequence-matched 20-nucleotide dsDNA or dsRNA or one of two functionally equivalent sets of sequence-matched 40-nucleotide ssDNA or ssRNA oligomers. Gels were stained for protein or nucleic acid as indicated. Lanes containing protein only at the highest listed concentration (P), 800 ng of nucleic acid only (N), dsDNA ladder marker (M), and mixtures of protein with 800 ng nucleic acid are indicated. Protein concentration decreases in twofold increments from left to right within the indicated range. Maximum protein concentrations used here were determined empirically by expression and stability in solution at 4°C. Electrophoretic mobility ranges for nucleic acids (black brackets), protein (small triangles), and protein-nucleic acid complexes (white brackets) are indicated on the right. SUD-C has a small net positive charge at neutral pH and migrated through the gel only in complex with nucleic acid (NA). Results from two single-stranded nucleic acid sequences that behaved equivalently in non-sequence-specific EMSA are shown. (B) Binding curves were constructed from densitometry data calibrated to the maximum and minimum binding in each gel. The range in which increasing nucleic acid binding was observed is indicated with a bold line above each graph to facilitate comparison. SUD binding curves may overestimate affinity since maximal binding overlapped with the limit of protein solubility.
FIG. 7.
FIG. 7.
Duplex unwinding activity of NAB and comparison with SARS-CoV nucleoprotein amino-terminal structured domain (N-NTD). Samples of NAB (A) or N-NTD (B) protein and single-stranded or duplex nucleic acid were mixed and incubated as for EMSA and then chilled overnight to allow the protein-nucleic acid complexes to dissociate before analysis by native PAGE. Lanes containing the highest concentration of protein only (P), nucleic acid only (N), and dsDNA marker (M) are indicated. Double-stranded (filled triangles) and single-stranded (open triangles) nucleic acids were detected with SYBR-gold dye, which stains double-stranded nucleic acid more prominently than single-stranded nucleic acid. Protein concentration decreases in twofold increments within the range shown. Enlargements showing the dose-dependent nucleic acid unwinding activity are included at the bottom of each panel.
FIG. 8.
FIG. 8.
Use of amino acid conservation to infer function for experimentally uncharacterized nsp3 domains. Average percent identity (API) was measured by pairwise alignment of conserved proteins and domains from different subgroups (Ia versus Ib, IIa versus IIb, etc.) or groups (I versus III, etc.). Conserved coronavirus proteins are grouped by functional class, including enzymes (P-E; nsp5, nsp12, nsp13, nsp14, nsp15, and nsp16), nonenzymatic proteins (P-NE; M and E), enzymatic domains (D-E; ADRP, PL1pro, and PL2pro), and putative nonenzymatic domains (D-NE; UB1, AC, SUD-C, UB2, NAB, and two nucleoprotein domains). Dotted lines mark intersubgroup API values associated with domains not found in all groups (PLP1, SUD-C, NAB, and G2M). Subgroup-specific markers such as SARS-CoV MBD were not included. Uncharacterized nsp3 domains clustering with enzymatic (UD-E; Y1, Y2, and Y3) and nonenzymatic (UD-NE; TM1-2, ZF, TM3-4, and G2M) classes are indicated.

Similar articles

Cited by

References

    1. Altschul, S. F., W. Gish, W. Miller, E. W. Myers, and D. J. Lipman. 1990. Basic local alignment search tool. J. Mol. Biol. 215403-410. - PubMed
    1. Barabási, A. L., and Z. N. Oltvai. 2004. Network biology: understanding the cell's functional organization. Nat. Rev. Genet. 5101-113. - PubMed
    1. Barretto, N., D. Jukneliene, K. Ratia, Z. Chen, A. D. Mesecar, and S. C. Baker. 2005. The papain-like protease of severe acute respiratory syndrome coronavirus has deubiquitinating activity. J. Virol. 7915189-15198. - PMC - PubMed
    1. Bern, M., D. Goldberg, W. H. McDonald, and J. R. Yates III. 2004. Automatic quality assessment of peptide tandem mass spectra. Bioinformatics 20(Suppl. 1)i49-i54. - PubMed
    1. Bertini, I., and C. Luchinat. 1984. High spin cobalt(II) as a probe for the investigation of metalloproteins. Adv. Inorg. Biochem. 671-111. - PubMed

Publication types

LinkOut - more resources