

Genomics of signaling crosstalk of estrogen receptor alpha in breast cancer cells
- PMID: 18365014
- PMCID: PMC2268000
- DOI: 10.1371/journal.pone.0001859
Genomics of signaling crosstalk of estrogen receptor alpha in breast cancer cells
Abstract
Background: The estrogen receptor alpha (ERalpha) is a ligand-regulated transcription factor. However, a wide variety of other extracellular signals can activate ERalpha in the absence of estrogen. The impact of these alternate modes of activation on gene expression profiles has not been characterized.
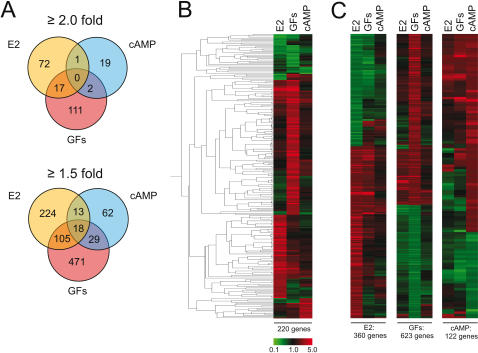
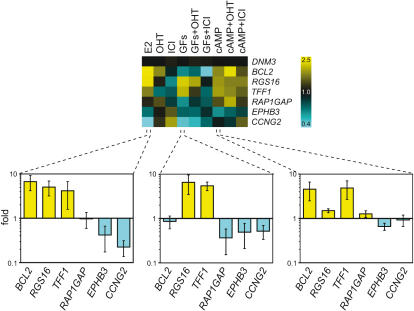
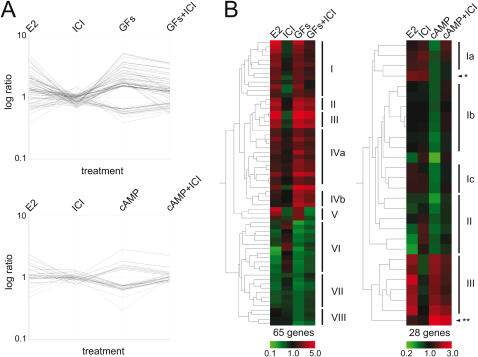
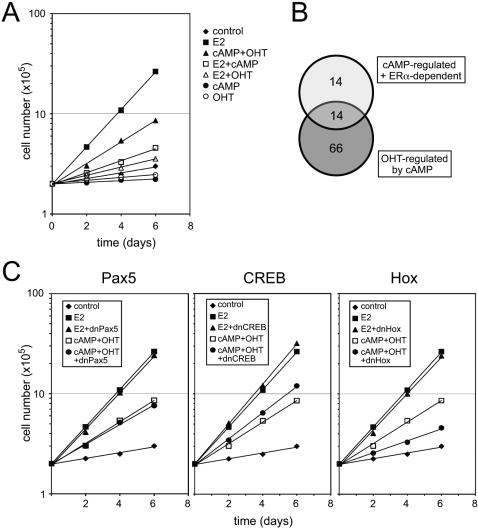
Methodology/principal findings: We show that estrogen, growth factors and cAMP elicit surprisingly distinct ERalpha-dependent transcriptional responses in human MCF7 breast cancer cells. In response to growth factors and cAMP, ERalpha primarily activates and represses genes, respectively. The combined treatments with the anti-estrogen tamoxifen and cAMP or growth factors regulate yet other sets of genes. In many cases, tamoxifen is perverted to an agonist, potentially mimicking what is happening in certain tamoxifen-resistant breast tumors and emphasizing the importance of the cellular signaling environment. Using a computational analysis, we predicted that a Hox protein might be involved in mediating such combinatorial effects, and then confirmed it experimentally. Although both tamoxifen and cAMP block the proliferation of MCF7 cells, their combined application stimulates it, and this can be blocked with a dominant-negative Hox mutant.
Conclusions/significance: The activating signal dictates both target gene selection and regulation by ERalpha, and this has consequences on global gene expression patterns that may be relevant to understanding the progression of ERalpha-dependent carcinomas.
Conflict of interest statement
Figures


Similar articles
-
Protein kinase A exhibits selective modulation of estradiol-dependent transcription in breast cancer cells that is associated with decreased ligand binding, altered estrogen receptor alpha promoter interaction, and changes in receptor phosphorylation.Mol Endocrinol. 2007 Feb;21(2):439-56. doi: 10.1210/me.2006-0059. Epub 2006 Oct 26. Mol Endocrinol. 2007. PMID: 17068199
-
ERE-independent ERalpha target genes differentially expressed in human breast tumors.Mol Cell Endocrinol. 2005 Dec 21;245(1-2):53-9. doi: 10.1016/j.mce.2005.10.003. Epub 2005 Nov 17. Mol Cell Endocrinol. 2005. PMID: 16298037
-
Notch-1 activates estrogen receptor-alpha-dependent transcription via IKKalpha in breast cancer cells.Oncogene. 2010 Jan 14;29(2):201-13. doi: 10.1038/onc.2009.323. Epub 2009 Oct 19. Oncogene. 2010. PMID: 19838210 Free PMC article.
-
A transcriptional repressive role for epithelial-specific ETS factor ELF3 on oestrogen receptor alpha in breast cancer cells.Biochem J. 2016 Apr 15;473(8):1047-61. doi: 10.1042/BCJ20160019. Epub 2016 Feb 26. Biochem J. 2016. PMID: 26920025
-
Estrogen receptors in breast carcinogenesis and endocrine therapy.Mol Cell Endocrinol. 2015 Dec 15;418 Pt 3:240-4. doi: 10.1016/j.mce.2014.11.015. Epub 2014 Nov 26. Mol Cell Endocrinol. 2015. PMID: 25433206 Review.
Cited by
-
CARM1 mediates the ligand-independent and tamoxifen-resistant activation of the estrogen receptor alpha by cAMP.Genes Dev. 2010 Apr 1;24(7):708-19. doi: 10.1101/gad.568410. Genes Dev. 2010. PMID: 20360387 Free PMC article.
-
Of Oestrogens and Sperm: A Review of the Roles of Oestrogens and Oestrogen Receptors in Male Reproduction.Int J Mol Sci. 2017 Apr 25;18(5):904. doi: 10.3390/ijms18050904. Int J Mol Sci. 2017. PMID: 28441342 Free PMC article. Review.
-
Minireview: Tipping the balance: ligand-independent activation of steroid receptors.Mol Endocrinol. 2015 Mar;29(3):349-63. doi: 10.1210/me.2014-1315. Epub 2015 Jan 27. Mol Endocrinol. 2015. PMID: 25625619 Free PMC article. Review.
-
A role for estrogen receptor phosphorylation in the resistance to tamoxifen.Int J Breast Cancer. 2011;2011:232435. doi: 10.4061/2011/232435. Epub 2011 Jul 12. Int J Breast Cancer. 2011. PMID: 22295213 Free PMC article.
-
Downregulation of steroid receptor coactivator-2 modulates estrogen-responsive genes and stimulates proliferation of mcf-7 breast cancer cells.PLoS One. 2013 Jul 30;8(7):e70096. doi: 10.1371/journal.pone.0070096. Print 2013. PLoS One. 2013. PMID: 23936147 Free PMC article.
References
-
- Katzenellenbogen BS, Norman MJ. Multihormonal regulation of the progesterone receptor in MCF-7 human breast cancer cells: interrelationships among insulin/insulin-like growth factor-I, serum, and estrogen. Endocrinology. 1990;126:891–898. - PubMed
-
- Picard D. SCOPE/IUPAC project on environmental implications of endocrine active substances: Molecular mechanisms of cross-talk between growth factors and nuclear receptor signaling. Pure Appl Chem. 2003;75:1743–1756.
-
- Ignar-Trowbridge DM, Teng CT, Ross KA, Parker MG, Korach KS, et al. Peptide growth factors elicit estrogen receptor-dependent transcriptional activation of an estrogen-responsive element. Mol Endocrinol. 1993;7:992–998. - PubMed
Publication types
MeSH terms
Substances
LinkOut - more resources
Full Text Sources
Other Literature Sources
Medical
Molecular Biology Databases
