A complex deoxyribonucleic acid looping configuration associated with the silencing of the maternal Igf2 allele
- PMID: 18356289
- PMCID: PMC2422825
- DOI: 10.1210/me.2007-0474
A complex deoxyribonucleic acid looping configuration associated with the silencing of the maternal Igf2 allele
Abstract
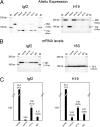
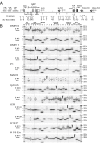
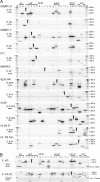
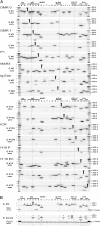
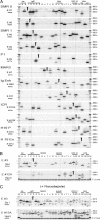
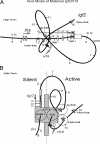
Alternate interactions between the H19 imprinting control region (ICR) and one of the two Igf2 differentially methylated regions has been proposed as a model regulating the reciprocal imprinting of Igf2 and H19. To study the conformation of this imprint switch, we performed a systematic structural analysis across the 140 kb of the mouse Igf2-H19 region, which includes enhancers located both between the two genes as well as downstream of H19, by using a scanning chromosome conformation capture (3C) technique. Our results suggest that on the active paternal Igf2 allele, the various enhancers have direct access to the Igf2 promoters, whereas the imprinted silent maternal Igf2 allele assumes a complex three-dimensional knotted loop that keeps the enhancers away from the Igf2 promoters and allows them to interact with the H19 promoter. This complex DNA looping of the maternal allele is formed by interactions involving differentially methylated region 1, the ICR, and enhancers. Binding of CTC-binding factor to the maternal, unmethylated ICR in conjunction with the presence of multicomplex components including interchromosomal interactions, create a barrier blocking the access of all enhancers to Igf2, thereby silencing the maternal Igf2. This silencing configuration exists in newborn liver, mouse embryonic fibroblast, and embryonic stem cells and persists during mitosis, conferring a mechanism for epigenetic memory.
Figures

Similar articles
-
CTCF binding at the H19 imprinting control region mediates maternally inherited higher-order chromatin conformation to restrict enhancer access to Igf2.Proc Natl Acad Sci U S A. 2006 Jul 11;103(28):10684-9. doi: 10.1073/pnas.0600326103. Epub 2006 Jun 30. Proc Natl Acad Sci U S A. 2006. PMID: 16815976 Free PMC article.
-
Three-dimensional conformation at the H19/Igf2 locus supports a model of enhancer tracking.Hum Mol Genet. 2008 Oct 1;17(19):3021-9. doi: 10.1093/hmg/ddn200. Epub 2008 Jul 10. Hum Mol Genet. 2008. PMID: 18617529 Free PMC article.
-
Regulatory mechanisms at the mouse Igf2/H19 locus.Mol Cell Biol. 2001 Dec;21(23):8189-96. doi: 10.1128/MCB.21.23.8189-8196.2001. Mol Cell Biol. 2001. PMID: 11689707 Free PMC article.
-
Igf2/H19 imprinting control region (ICR): an insulator or a position-dependent silencer?ScientificWorldJournal. 2001 Jun 5;1:218-24. doi: 10.1100/tsw.2001.50. ScientificWorldJournal. 2001. PMID: 12806090 Free PMC article. Review.
-
Mechanisms of Igf2/H19 imprinting: DNA methylation, chromatin and long-distance gene regulation.J Biochem. 2000 May;127(5):711-5. doi: 10.1093/oxfordjournals.jbchem.a022661. J Biochem. 2000. PMID: 10788777 Review.
Cited by
-
Quantitative allele-specific expression and DNA methylation analysis of H19, IGF2 and IGF2R in the human placenta across gestation reveals H19 imprinting plasticity.PLoS One. 2012;7(12):e51210. doi: 10.1371/journal.pone.0051210. Epub 2012 Dec 5. PLoS One. 2012. PMID: 23227253 Free PMC article.
-
Identifying multi-locus chromatin contacts in human cells using tethered multiple 3C.BMC Genomics. 2015 Feb 25;16(1):121. doi: 10.1186/s12864-015-1236-7. BMC Genomics. 2015. PMID: 25887659 Free PMC article.
-
Analysis of neonatal brain lacking ATRX or MeCP2 reveals changes in nucleosome density, CTCF binding and chromatin looping.Nucleic Acids Res. 2014 Jul;42(13):8356-68. doi: 10.1093/nar/gku564. Epub 2014 Jul 2. Nucleic Acids Res. 2014. PMID: 24990380 Free PMC article.
-
Cohesin is required for higher-order chromatin conformation at the imprinted IGF2-H19 locus.PLoS Genet. 2009 Nov;5(11):e1000739. doi: 10.1371/journal.pgen.1000739. Epub 2009 Nov 26. PLoS Genet. 2009. PMID: 19956766 Free PMC article.
-
A novel antisense long noncoding RNA within the IGF1R gene locus is imprinted in hematopoietic malignancies.Nucleic Acids Res. 2014 Sep;42(15):9588-601. doi: 10.1093/nar/gku549. Epub 2014 Aug 4. Nucleic Acids Res. 2014. PMID: 25092925 Free PMC article.
References
-
- DeChiara TM, Robertson EJ, Efstratiadis A 1991 Parental imprinting of the mouse insulin-like growth factor II gene. Cell 64:849–859 - PubMed
-
- Bartolomei MS, Zemel S, Tilghman SM 1991 Parental imprinting of the mouse H19 gene. Nature 351:153–155 - PubMed
-
- Zemel S, Bartolomei MS, Tilghman SM 1992 Physical linkage of two mammalian imprinted genes, H19 and insulin-like growth factor 2. Nat Genet 2:61–65 - PubMed
-
- Leighton PA, Saam JR, Ingram RS, Stewart CL, Tilghman SM 1995 An enhancer deletion affects both H19 and Igf2 expression. Genes Dev 9:2079–2089 - PubMed
-
- Bell AC, Felsenfeld G 2000 Methylation of a CTCF-dependent boundary controls imprinted expression of the Igf2 gene. Nature 405:482–485 - PubMed
Publication types
MeSH terms
Substances
Grants and funding
LinkOut - more resources
Full Text Sources
Miscellaneous

