. 2008 Jun 5;375(2):331-41.
doi: 10.1016/j.virol.2008.02.021. Epub 2008 Mar 18.

Early growth response-1 protein is induced by JC virus infection and binds and regulates the JC virus promoter

Affiliations

Early growth response-1 protein is induced by JC virus infection and binds and regulates the JC virus promoter

Luca Romagnoli et al. Virology. .

Abstract

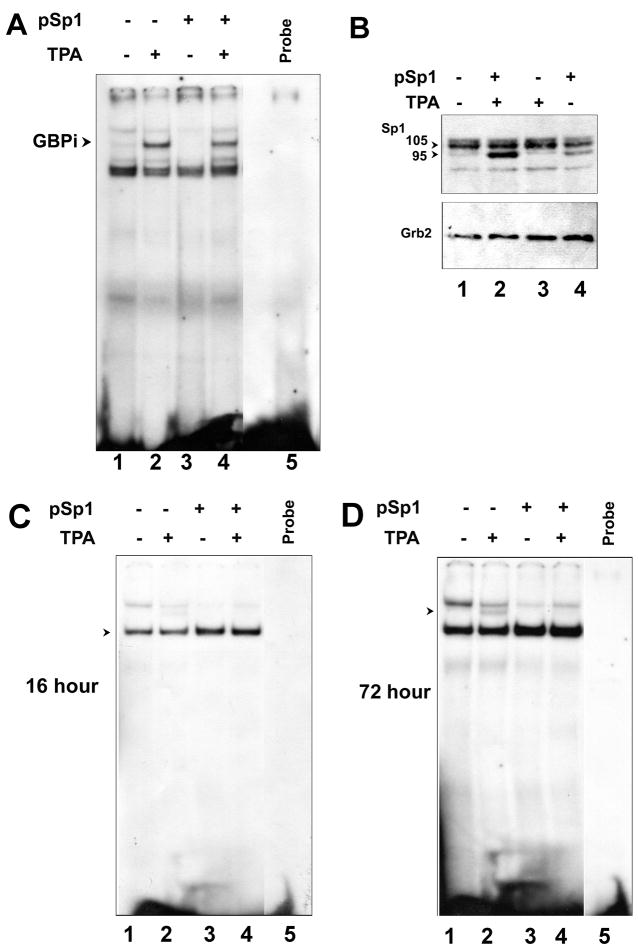
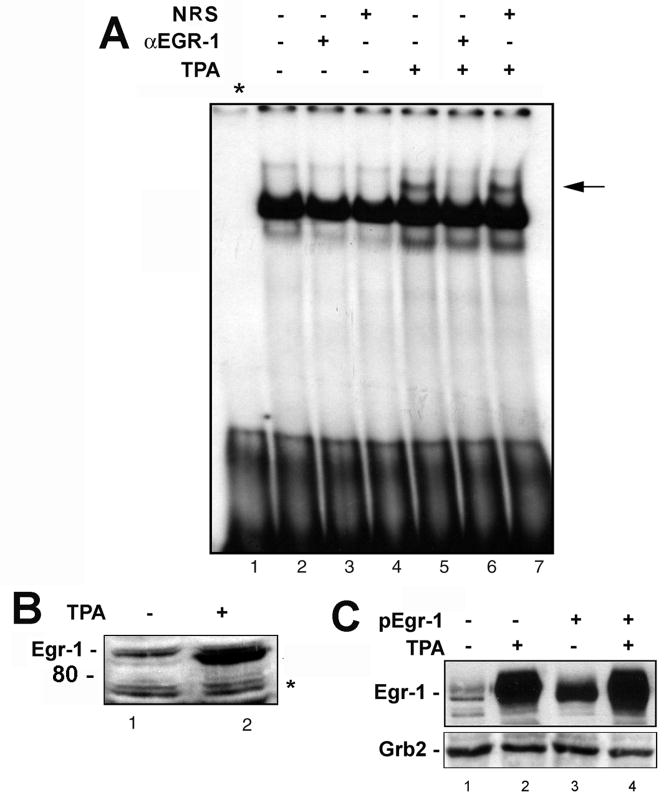
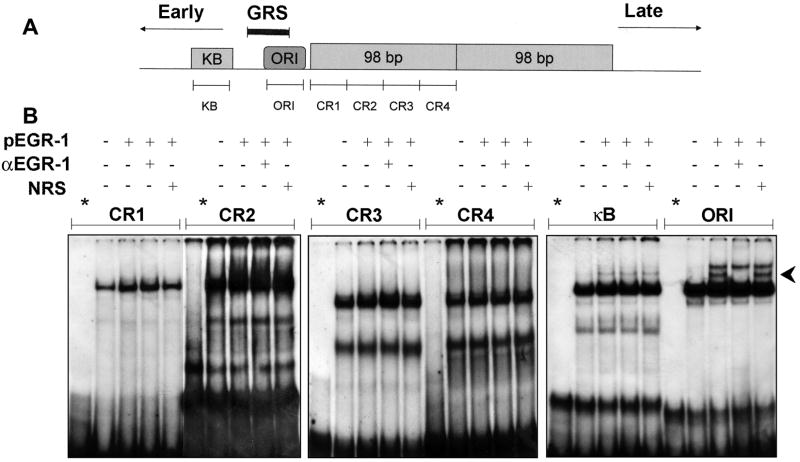
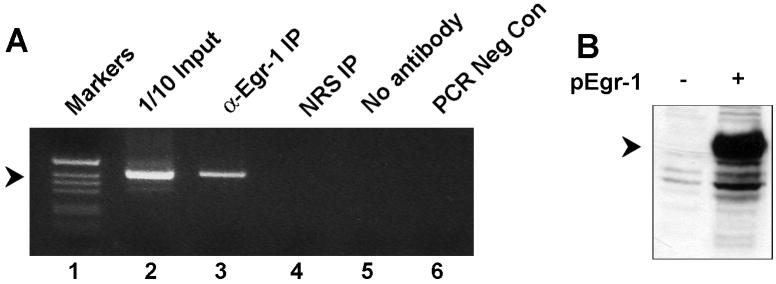
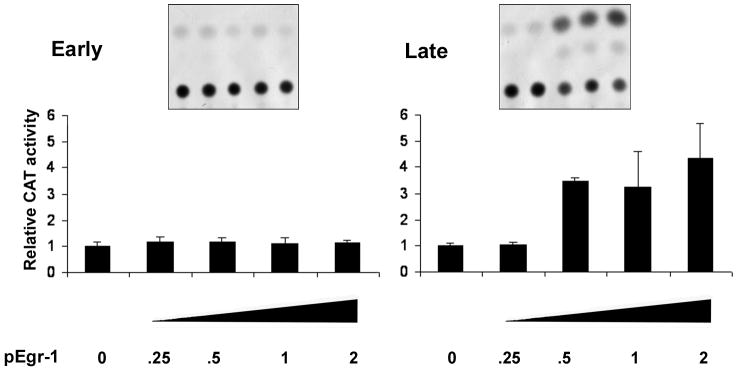
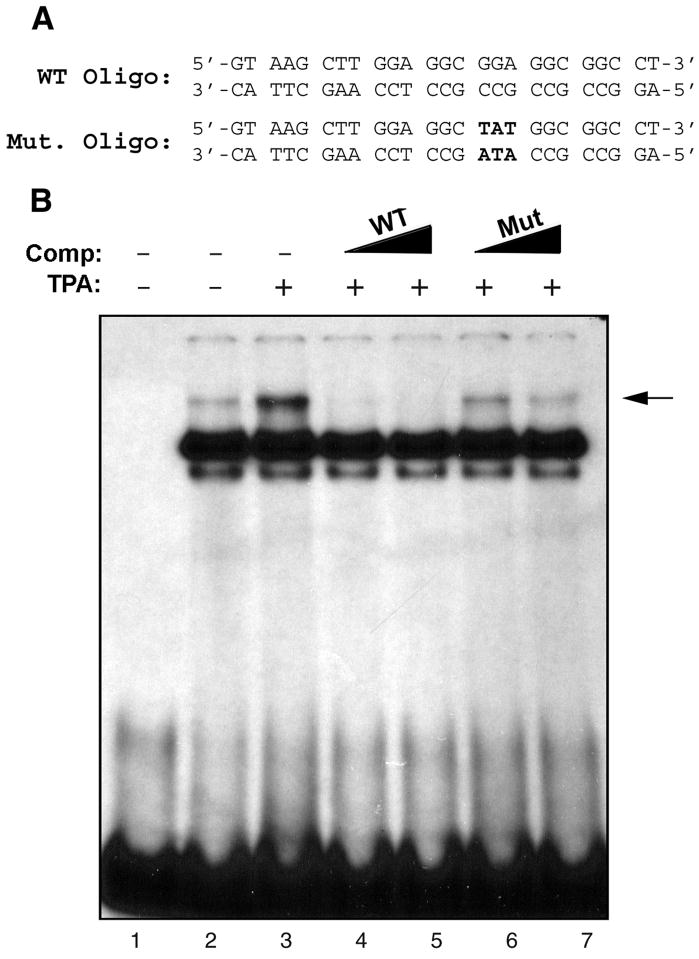
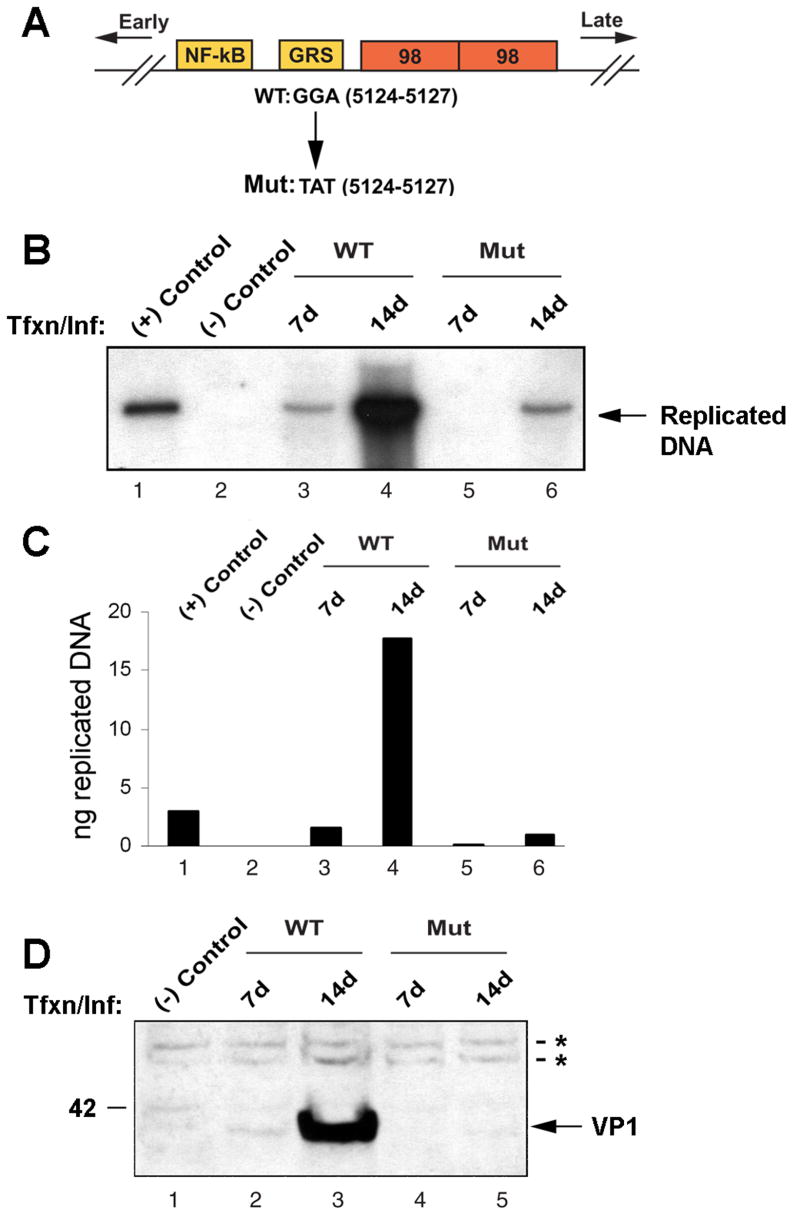
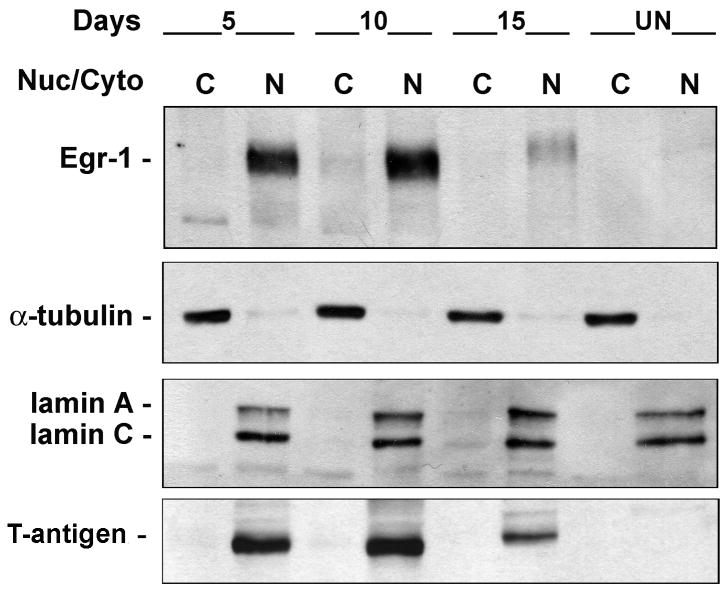
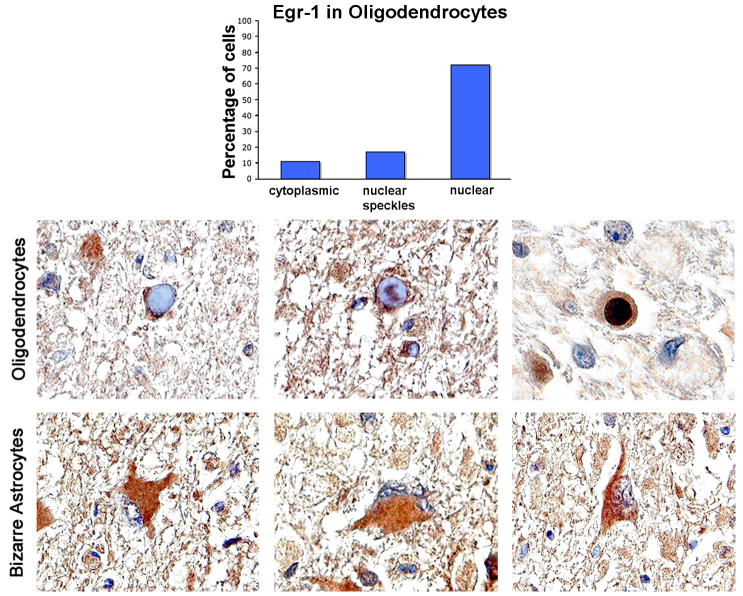
JC virus (JCV) is a human polyomavirus that can emerge from a latent state to cause the cytolytic destruction of oligodendrocytes in the brain resulting in the fatal demyelinating disease, progressive multifocal leukoencephalopathy (PML). Previous studies described a cis-acting transcriptional regulatory element in the JCV non-coding control region (NCCR) that is involved in the response of JCV to cytokines. This consists of a 23 base pair GGA/C rich sequence (GRS) near the replication origin (5112 to +4) that contains potential binding sites for Sp1 and Egr-1. Gel shift analysis showed that Egr-1, but not Sp1, bound to GRS. Evidence is presented that the GRS gel shift seen on cellular stimulation is due to Egr-1. Thus, TPA-induced GRS gel shift could be blocked by antibody to Egr-1. Further, the TPA-induced GRS DNA/protein complex was isolated and found to contain Egr-1 by Western blot. No other Egr-1 sites were found in the JCV NCCR. Functionally, Egr-1 was found to stimulate transcription of JCV late promoter but not early promoter reporter constructs. Mutation of the Egr-1 site abrogated Egr-1 binding and virus with the mutated Egr-1 site showed markedly reduced VP1 expression and DNA replication. Infection of primary astrocytes by wild-type JCV induced Egr-1 nuclear expression that was maximal at 5-10 days post-infection. Finally, upregulation of Egr-1 was detected in PML by immunohistochemistry. These data suggest that Egr-1 induction may be important in the life cycle of JCV and PML pathogenesis.


Figures

Figure 1
Figure 1. Sp1 fails to bind to GRS
U-87 MG cells were transfected with plasmid expressing Sp1 and/or treated with TPA as described in Materials and Methods. A. Nuclear proteins were extracted and used in a gel shift assay. B. Overexpression of Sp1 was confirmed by Western blot. Grb2 was used as a loading control. C and D. Binding of Sp1 and GBPi to an authentic Sp1 site from the mouse cyclin-dependent kinase 5 regulatory subunit p35 promoter was evaluated with autoradiography exposure times of 16 and 72 hours respectively.
Figure 2
Figure 2. Egr-1 binds to the GRS element
A. U-87 MG cells were treated with TPA as described in Materials and Methods and gel shifts were performed with nuclear extracts in the presence and absence of antibody to Egr-1 (α-Egr-1) or non-immune rabbit serum as indicated. Lane 1 - free probe. The arrow indicates the GBPi gel shift band. B. The nuclear extracts from Panel A were analyzed by Western blot for Egr-1 expression. The asterisk indicates a nonspecific band that indicates equivalent protein loading. C. In a separate experiment, U-87 MG cells were transfected with plasmid expressing Egr-1 and/or treated with TPA as described in Materials and Methods. Expression of Egr-1 was evaluated by Western blot with Grb2 as loading control.
Figure 3
Figure 3. Detection of Egr-1 in the GBPi:GRS protein-DNA complex
A. Nuclear extracts from U-87 MG cells treated with or without TPA were incubated with cold double-stranded GRS oligodeoxyribonucleotide probe that had been spiked with [32P]-labeled GRS probe, electrophoresed on a non-denaturing PAGE and subject to autoradiography. * - Free probe. After autoradiography, the developed X-ray film was used for alignment to allow gel slices to be excised from the gel for each lane at the positions labeled “b” and “i”. B. Gel slices corresponding to bands at positions b and i in the −TPA and +TPA lanes (Panel A) were stored at −80°C for several months to allow the 32P to decay. To determine if the DNA:protein complexes contained in these bands contained Egr-1, the gel slices were boiled in Laemmli sample buffer containing SDS and subject to SDS PAGE followed by Western blotting with antibody to Egr-1.
Figure 4
Figure 4. Gel shift analysis for Egr-1 sites found within the JCV NCCR 98 bp repeat and the NF-κB binding region
A. Schematic depiction of NCCR of Mad-1 strain of JCV showing positions of gel shift probes. B. U-87 MG cells were transfected with or without plasmid expressing Egr-1 (pEGR-1), nuclear extracts harvested and gel shift assays performed with JCV probes and antibody to Egr-1 as indicated.
Figure 5
Figure 5. Egr-1 binds to the JCV NCCR in vivo
U-87 MG cells were transfected with plasmid containing the JCV NCCR and plasmid expressing Egr-1. After crosslinking, ChIP assays were performed as described in Materials and Methods. 1/10 of the input extract was used as a positive control.
Figure 6
Figure 6. Egr-1 stimulates the JCV late promoter
U-87 MG cells were transfected with either JCVE-CAT (left panel) or JCVL-CAT (right panel) together with various amounts (μg) of plasmid expressing Egr-1. CAT activities were measured and normalized relative to cells expressing reporter plasmid alone. Triplicate analyses were performed and error bars represent the standard deviation.
Figure 7
Figure 7. Mutation of the Egr-1 binding site abrogates Egr-1 binding
A. GRS wild-type (WT) and mutant (Mut) oligonucleotide sequences spanning nucleotides 5112 to 4 of JCV Mad-1 regulatory region. Nucleotides in bold font indicate the base substitution within the Mut oligonucleotide relative to the WT oligonucleotide. B. WT and Mut oligonucleotides were end-labeled with [γ]-32ATP with T4 polynucleotide kinase and purified. Nuclear extracts (10 μg/lane) prepared from U-87MG cells either untreated (lane 2) or treated (lane 3) or with TPA (75 ng/ml) for 1.5 h were incubated labeled wild-type GRS probe (50,000 cpm/lane) in a binding buffer. In addition, probe plus nuclear extract mixture was incubated either with unlabeled WT (lanes 4 and 5, in 50- and 150-fold molar excess respectively) or Mut (lanes 6 and 7, in 50- and 150-fold molar excess respectively) oligonucleotide, which serve as competitors. DNA-protein complexes were then resolved on a 6% polyacrylamide gel under native conditions and visualized by autoradiography. An arrow indicates the specific DNA-protein complexes. Oligo: Oligonucleotide, Comp: Competitor.
Figure 8
Figure 8. Virus with mutation of the Egr-1 binding site is defective in DNA replication and late gene expression
A. A schematic representation of the JCV Mad-1 regulatory region indicating position of the trinucleotide mutation in the mutant virus. Orientation of early and late gene expression is indicated. The relative location of NF-κB, GRS and 98 bp tandem repeats are also indicated. GGA sequences in WT virus (JCV Mad-1, 5124–5127) were substituted with TAT sequences in the mutant virus. B. Analysis of DNA replication for the mutant virus. SVG-A cells were transfected/infected with either Mad-1 WT genome or its Egr-1 binding mutant genome (Mut, 8 μg/2 × 106 cells/75cm2 flask) using lipofectin as described in Materials and Methods. At 7d and 14d after transfection, low molecular weight DNA was isolated by a Qiagen spin columns, digested with Bam HI and Dpn I restriction enzymes, resolved on a 0.8% agarose gel and analyzed by Southern blotting. In lane 1, Mad-1 wild-type genome (3 ng) digested with Bam HI was loaded as a positive control. In lane 2, DNA isolated from uninfected cells was loaded as a negative control. C. A quantitative analysis of the data from panel B. The nitrocellulose filter from Panel B was analyzed using a Bio-Rad Molecular Imager FX phosphorimager and the intensity of each band measured using the Bio-Rad Quantity One Quantitation Analysis Software. The intensity of each band relative to the positive control (3 ng) was used to calculate the equivalent amount of replicated DNA in each sample. D. In parallel to the studies described for Panel B, whole cell lysates were also prepared at the time points indicated and analyzed by Western blot using an anti-VP1 antibody (AB597, kindly provided by W. Atwood, Brown University, Rhode Island). In lane 1, whole cell extract from untransfected/uninfected cells was loaded as a negative control. Tfxn: transfection, Inf: infection. The migration pattern of a molecular weight marker is shown on the left side of the panel in kilodalton. The asterisks indicate nonspecific bands present in uninfected and infected cells that serve to show equivalent protein loading.
Figure 9
Figure 9. Expression of Egr-1 during JCV infection of primary astrocytes
Primary human astrocytes were infected with JCV and cytoplasmic and nuclear fractions isolated from cells 5, 10 and 15 days post-infection and from uninfected controls. Western blot was performed for Egr-1, α-tubulin (cytoplasmic marker), lamin A/C (nuclear marker) and T-antigen (control for infection).
Figure 10
Figure 10. Detection of Egr-1 in JCV-infected cells of PML cases
Immunohistochemistry was performed for Egr-1 as described in Materials and Methods. Three representative fields each are shown for oligodendrocytes and astrocytes. Egr-1 shows robust labeling of the inclusion body-harboring oligodendrocytes, within plaques of demyelination in PML cases. Three patterns of labeling were observed; cytoplasmic (left-hand oligodendrocyte panel), nuclear speckled (middle oligodendrocyte panel) and nuclear (right-hand oligodendrocyte panel). One hundred cells were counted and scored for their labeling pattern. 11% showed cytoplasmic labeling, 17% nuclear speckled labeling and 72% nuclear labeling. These data are depicted as a histogram. Bizarre astrocytes, also within demyelinated lesions demonstrated 100% cytoplasmic immunoreactivity (lower panels). All panels are original magnification (x1000).

Similar articles

Cited by

References

    1. Amini S, Mameli G, Del Valle L, Skowronska A, Reiss K, Gelman BB, White MK, Khalili K, Sawaya BE. p73 Interacts with human immunodeficiency virus type 1 Tat in astrocytic cells and prevents its acetylation on lysine 28. Mol Cell Biol. 2005;25:8126–8138. - PMC - PubMed
    1. Berger JR, Houff S. Progressive multifocal leukoencephalopathy: lessons from AIDS and natalizumab. Neurol Res. 2006;28:299–305. - PubMed
    1. Cai Y, Liu Y, Zhang X. Induction of transcription factor Egr-1 gene expression in astrocytoma cells by Murine coronavirus infection. Virology. 2006;355:152–163. - PMC - PubMed
    1. Cartharius K, Frech K, Grote K, Klocke B, Haltmeier M, Klingenhoff A, Frisch M, Bayerlein M, Werner T. MatInspector and beyond: promoter analysis based on transcription factor binding sites. Bioinformatics. 2005;21:2933–2942. - PubMed
    1. Chang CF, Otte J, Kerr DA, Valkkila M, Calkins CE, Khalili K. Evidence that the soluble factors secreted by activated immune cells suppress replication of human neurotropic JC virus DNA in glial cells. Virology. 1996;221:226–231. - PubMed

Publication types

MeSH terms