Polyomavirus BK with rearranged noncoding control region emerge in vivo in renal transplant patients and increase viral replication and cytopathology
- PMID: 18347101
- PMCID: PMC2292223
- DOI: 10.1084/jem.20072097
Polyomavirus BK with rearranged noncoding control region emerge in vivo in renal transplant patients and increase viral replication and cytopathology
Abstract
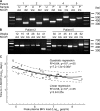
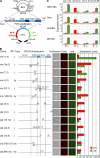
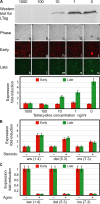
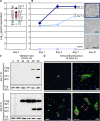
Immunosuppression is required for BK viremia and polyomavirus BK-associated nephropathy (PVAN) in kidney transplants (KTs), but the role of viral determinants is unclear. We examined BKV noncoding control regions (NCCR), which coordinate viral gene expression and replication. In 286 day-matched plasma and urine samples from 129 KT patients with BKV viremia, including 70 with PVAN, the majority of viruses contained archetypal (ww-) NCCRs. However, rearranged (rr-) NCCRs were more frequent in plasma than in urine samples (22 vs. 4%; P < 0.001), and were associated with 20-fold higher plasma BKV loads (2.0 x 10(4)/ml vs. 4.4 x 10(5)/ml; P < 0.001). Emergence of rr-NCCR in plasma correlated with duration and peak BKV load (R(2) = 0.64; P < 0.001). This was confirmed in a prospective cohort of 733 plasma samples from 227 patients. For 39 PVAN patients with available biopsies, rr-NCCRs were associated with more extensive viral replication and inflammation. Cloning of 10 rr-NCCRs revealed diverse duplications or deletions in different NCCR subregions, but all were sufficient to increase early gene expression, replication capacity, and cytopathology of recombinant BKV in vitro. Thus, rr-NCCR BKV emergence in plasma is linked to increased replication capacity and disease in KTs.
Figures


Similar articles
-
Functional analysis of polyomavirus BK non-coding control region quasispecies from kidney transplant recipients.J Med Virol. 2009 Nov;81(11):1959-67. doi: 10.1002/jmv.21605. J Med Virol. 2009. PMID: 19774689
-
Polyomavirus BK versus JC replication and nephropathy in renal transplant recipients: a prospective evaluation.Transplantation. 2007 Aug 15;84(3):323-30. doi: 10.1097/01.tp.0000269706.59977.a5. Transplantation. 2007. PMID: 17700156
-
Early monitoring of the human polyomavirus BK replication and sequencing analysis in a cohort of adult kidney transplant patients treated with basiliximab.Virol J. 2011 Aug 17;8:407. doi: 10.1186/1743-422X-8-407. Virol J. 2011. PMID: 21849069 Free PMC article.
-
Noncoding control region of naturally occurring BK virus variants: sequence comparison and functional analysis.Virus Genes. 1995;10(3):261-75. doi: 10.1007/BF01701816. Virus Genes. 1995. PMID: 8560788 Review.
-
BK virus large T and VP-1 expression in infected human renal allografts.Nephrol Dial Transplant. 2008 Dec;23(12):3752-61. doi: 10.1093/ndt/gfn470. Epub 2008 Sep 9. Nephrol Dial Transplant. 2008. PMID: 18784088 Free PMC article. Review.
Cited by
-
Rearranged JC virus noncoding control regions found in progressive multifocal leukoencephalopathy patient samples increase virus early gene expression and replication rate.J Virol. 2010 Oct;84(20):10448-56. doi: 10.1128/JVI.00614-10. Epub 2010 Aug 4. J Virol. 2010. PMID: 20686041 Free PMC article.
-
Mutations in the external loops of BK virus VP1 and urine viral load in renal transplant recipients.J Cell Physiol. 2010 Jan;222(1):195-9. doi: 10.1002/jcp.21937. J Cell Physiol. 2010. PMID: 19780025 Free PMC article.
-
Replication of oral BK virus in human salivary gland cells.J Virol. 2014 Jan;88(1):559-73. doi: 10.1128/JVI.02777-13. Epub 2013 Oct 30. J Virol. 2014. PMID: 24173219 Free PMC article.
-
Subtyping of BK Virus in Iranian Turkish Renal Transplant Recipients by RFLP-PCR.Maedica (Bucur). 2012 Jan;7(1):10-3. Maedica (Bucur). 2012. PMID: 23118813 Free PMC article.
-
Differential patterns of large tumor antigen-specific immune responsiveness in patients with BK polyomavirus-positive prostate cancer or benign prostatic hyperplasia.J Virol. 2012 Aug;86(16):8461-71. doi: 10.1128/JVI.00005-12. Epub 2012 May 30. J Virol. 2012. PMID: 22647697 Free PMC article.
References
-
- Hirsch, H.H., W. Knowles, M. Dickenmann, J. Passweg, T. Klimkait, M.J. Mihatsch, and J. Steiger. 2002. Prospective study of polyomavirus type BK replication and nephropathy in renal-transplant recipients. N. Engl. J. Med. 347:488–496. - PubMed
-
- Randhawa, P.S., S. Finkelstein, V. Scantlebury, R. Shapiro, C. Vivas, M. Jordan, M.M. Picken, and A.J. Demetris. 1999. Human polyoma virus-associated interstitial nephritis in the allograft kidney. Transplantation. 67:103–109. - PubMed
-
- Ramos, E., C.B. Drachenberg, J.C. Papadimitriou, O. Hamze, J.C. Fink, D.K. Klassen, R.C. Drachenberg, A. Wiland, R. Wali, C.B. Cangro, et al. 2002. Clinical course of polyoma virus nephropathy in 67 renal transplant patients. J. Am. Soc. Nephrol. 13:2145–2151. - PubMed
-
- Vasudev, B., S. Hariharan, S.A. Hussain, Y.R. Zhu, B.A. Bresnahan, and E.P. Cohen. 2005. BK virus nephritis: risk factors, timing, and outcome in renal transplant recipients. Kidney Int. 68:1834–1839. - PubMed
-
- Drachenberg, C.B., J.C. Papadimitriou, H.H. Hirsch, R. Wali, C. Crowder, J. Nogueira, C.B. Cangro, S. Mendley, A. Mian, and E. Ramos. 2004. Histological patterns of polyomavirus nephropathy: correlation with graft outcome and viral load. Am. J. Transplant. 4:2082–2092. - PubMed
Publication types
MeSH terms
Substances
LinkOut - more resources
Full Text Sources
Other Literature Sources
Medical

