. 2008 Mar 15;22(6):770-85.
doi: 10.1101/gad.1640908.

Cooperation between the Hic1 and Ptch1 tumor suppressors in medulloblastoma

Affiliations

Cooperation between the Hic1 and Ptch1 tumor suppressors in medulloblastoma

Kimberly J Briggs et al. Genes Dev. .

Erratum in

  • Genes Dev. 2008 May 15;22(10):1410

Abstract

Medulloblastoma is an embryonal tumor thought to arise from the granule cell precursors (GCPs) of the cerebellum. PATCHED (PTCH), an inhibitor of Hedgehog signaling, is the best-characterized tumor suppressor in medulloblastoma. However, <20% of medulloblastomas have mutations in PTCH. In the search for other tumor suppressors, interest has focused on the deletion events at the 17p13.3 locus, the most common genetic defect in medulloblastoma. This chromosomal region contains HYPERMETHYLATED IN CANCER 1 (HIC1), a transcriptional repressor that is a frequent target of epigenetic gene silencing in medulloblastoma. Here we use a mouse model of Ptch1 heterozygosity to reveal a critical tumor suppressor function for Hic1 in medulloblastoma. When compared with Ptch1 heterozygous mutants, compound Ptch1/Hic1 heterozygotes display a fourfold increased incidence of medulloblastoma. We show that Hic1 is a direct transcriptional repressor of Atonal Homolog 1 (Atoh1), a proneural transcription factor essential for cerebellar development, and show that ATOH1 expression is required for human medulloblastoma cell growth in vitro. Given that Atoh1 is also a putative target of Hh signaling, we conclude that the Hic1 and Ptch1 tumor suppressors cooperate to silence Atoh1 expression during a critical phase in GCP differentiation in which malignant transformation may lead to medulloblastoma.


Figures
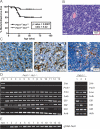
Figure 1.
Figure 1.
Hic1 interacts with Ptch1 in the pathogenesis of medulloblastoma. (A) Log-rank Kaplan Meier analysis of tumor incidence in Ptch1+/− Hic1+/− mice versus Ptch1+/− mice. (B) Hematoxylin/eosin staining of representative tumor from Ptch1+/− Hic1+/− animal. Bar, 20 μm. (C) Immunohistochemical stains for Synaptophysin (Syp), Glial fibrillary acid protein (Gfap), and Nestin (Nes) in a representative tumor, shown as DAB staining (brown), counterstained with hematoxylin (blue). Bars, 20 μm. (D) Semiquantitative Hh pathway expression profiling of 13 Ptch1+/− Hic1+/− and three Ptch1+/− tumors. Mouse fetal cerebellum (FC) (Clontech) used as positive control. (Shh) Sonic hedgehog; (Ptch1) Patched1; (Smo) Smoothened; (Actb) β-Actin. (E) Nonquantitative Ptch1 PCR on genomic DNA from 13 Ptch1+/− Hic1+/− tumors.
Figure 2.
Figure 2.
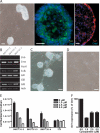
Medulloblastomas from Ptch1+/− Hic1+/− mice are Hh pathway-dependent. (A) A tumor-sphere cell line derived from a Ptch1+/− Hic1+/− tumor: phase contrast image (bar, 50 μm), immunofluorescent staining for Neuronal class III β-Tubulin (Tuj1) and Nestin (Nes) expression (bars, 25 μm). Nuclei counterstained with DAPI (blue). (B) Hh pathway expression profiling in three cell lines derived from a Ptch1+/− Hic1+/− tumor. (C) Representative phase contrast image of Ptch1+/− Hic1+/− tumor-sphere cell line treated with vehicle control (4×). (D) Representative phase contrast image of Ptch1+/− Hic1+/− cell line treated with 5 μM cyclopamine (4×) (bars, 50 μm). (E) Cell concentrations of Ptch1+/− Hic1+/− medulloblastoma cell lines B837TX1-2–B837TX1-4, and mouse fibroblast cell line NIH-3T3 (3T3) after 7 d of culture with 0 μM, 1 μM, 2.5 μM, or 5 μM cyclopamine. (0 μM) Vehicle control. Error bars reflect SEM of five biological replicates. (F) Gli1 quantitative PCR performed on RNA isolated from B837TX1-3 following 7 d of culture in 0 μM, 1 μM, 2.5 μM, or 5 μM cyclopamine. Data are graphed in relation to untreated B837TX1-3. Error bars reflect SEM of five biological replicates.
Figure 3.
Figure 3.
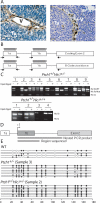
Analysis of Hic1 expression and methylation status in tumors. (A) Hic1 immunohistochemistry in a representative tumor (bars, 20 μm), shown as DAB staining (brown), counterstained with hematoxylin (blue). (Tu) Tumor; (V) blood vessel. (B) Schematic for HpaII-based PCR dense methylation analysis of mouse Hic1 promoters showing alternative exons 1a and 1b, and downstream coding exon or mutation. Circles represent number and approximate location of CpGs analyzed in this assay, and arrowheads represent locations of PCR primers. The figure is not drawn to scale. (C) PCR results from HpaII assay for nine Ptch1+/− Hic1+/− and four Ptch1+/− Hic1+/+ tumors. Hic1b wild type (WT) represents the PCR product resulting from primers located in exons 1b and 2. Hic1b Mut represents the PCR product resulting from primers in exons 1b and β-galactosidase. Hic1a represents the PCR product resulting from primers in exon 1a. The minus sign (−) denotes a mock digestion, and the plus sign (+) means that the genomic DNA was digested with HpaII prior to PCR amplification. (D) Hic1 promoter 1b bisulfite sequencing schematic. The nested PCR reaction is allele- specific (Nested PCR product). The region used as a template for bisulfate sequencing is shown (Region sequenced). The figure is not drawn to scale. (E) Bisulfite sequencing data for Ptch1+/− Sample 3 and Ptch1+/− Hic1+/− Sample 2 from B; wild type (WT) is an age-matched C57Bl/6 cerebellum. Each row represents the sequence from a single allele with the 5′ end at the left. Empty circles represent unmethylated cytosine.
Figure 4.
Figure 4.
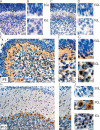
Hic1 expression in cerebellar development. Hic1 immunohistochemistry performed in C57Bl/6 animals aged to P5 and P15. All magnified sections are in the same orientation as original image. (A) Negative control P5 C57Bl/6 cerebellum, no primary antibody (bar, 20 μm). (B) Magnified EGL and IGL (bar, 6 μm). (C) Negative control P5 C57Bl/6 cerebellum stained with preblocked Hic1 antibody (bar, 20 μm). (D) Magnified EGL and IGL (bar, 6 μm). (E) P5 C57Bl/6 cerebellum (bar, 20 μm). (F) Magnified section of P5 cerebellum (bar, 10 μm). (G) Magnified EGL and IGL of P5 cerebellum (bar, 5 μm). (H) P15 C57Bl/6 cerebellum (bar, 30 μm). (I) Magnified section of P15 cerebellum (bar, 15 μm). (J) Magnified EGL, PCL, and IGL of P15 cerebellum (bar, 7 μm). Data are presented as DAB staining (brown), counterstained with hematoxylin (blue).
Figure 5.
Figure 5.
Hh signaling and Sirt1 expression in medulloblastoma. (A) Ptch1 and Gli1 quantitative PCR in MEFs derived from Hic1+/+, Hic1+/−, and Hic1−/− E17.5 embryos. MEFs were either treated with recombinant mouse Shh or a PBS control. Ptch1 and Gli1 transcript levels are graphed relative to untreated Hic1+/+ MEFs. Error bars reflect SEM of three biological replicates. (B) Sirt1 quantitative PCR in 12 Ptch1+/− Hic1+/− and three Ptch1+/− tumors. Sirt1 RNA expression is graphed relative to Sirt1 expression in C57Bl/6 adult cerebellum. Error bars reflect SEM of three technical replicates. (C) Sirt1 quantitative PCR in GCPs cultured for 7 d. Error bars reflect SEM of biological replicates.
Figure 6.
Figure 6.
Hic1 is a direct transcriptional repressor of Atoh1. (A) Semiquantitative PCR showing expression of Hedgehog pathway components; ATOH1 and HIC1 in human medulloblastoma cell lines D283, D341, D425 and Daoy; and human supratentorial PNET cell line PFSK. (B) HIC1 HpaII assay performed on human cell lines from A. HIC1b and HIC1a represent PCR products resulting from primers located in either exons 1b and 2, or exons 1a and 2, respectively. The minus sign (−) denotes a mock digestion, and the plus sign (+) means the genomic DNA was digested with HpaII prior to PCR amplification. (C) Semiquantitative PCR to validate ATOH1 microarray data in human medulloblastoma and supratentorial PNET cell lines. The minus sign (−) refers to transduction with a β-galactosidase-expressing adenovirus, and the plus sign (+) refers to transduction with a HIC1-expressing adenovirus. RNA was harvested 48 h post-transduction. (D) Schematic of ChIP experiment showing downstream Atoh1 enhancer region that contains sequence similar to the human HIC1-binding sequence. Solid arrows refer to PCR primer Pair 1, and dotted arrows refer to PCR primer Pair 2. The figure is not drawn to scale. (E) ChIP data from C57Bl/6 P7 and P14 cerebella immunoprecipitated with a Hic1 antibody and the denoted genes amplified by PCR. Representative PCR analyses done on the Hic1-immunoprecipitated (+), mock (−), and a 1:100 dilution of nonimmunoprecipitated (Input) DNA from both the P7 and P14 cerebella using β Actin (Actb) primers to show loading control and specificity of the ChIP.
Figure 7.
Figure 7.
ATOH1 is functionally important in medulloblastoma. (A) MTT analysis of human medulloblastoma cell lines D283, D341, D425, and Daoy, and human supratentorial PNET cell line PFSK either treated with adenovirus expressing β-galactosidase (AdCtrl) or HIC1 (AdHic1) for 6 d with replating every 48 h. Absorbance was measured at 540 nm (A540). Error bars reflect SEM of four biological replicates. (B) MTT analysis of human cell lines treated with adenovirus expressing β-galactosidase (AdCtrl), β-galactosidase and HIC1 (AdCtrl + AdHIC1), or HIC1 and ATOH1 (AdHIC1 + AdATOH1) for 6 d with replating every 48 h. Absorbance was measured at 540 nm (A540). Error bars reflect SEM of four biological replicates. (C) Representative quantitative PCR demonstrating success of siRNA knockdown of Atoh1 in B837TX1-2, a cell line derived from a Ptch1+/− Hic1+/− tumor. Data are graphed relative to the mock-transfected B837TX1-2 cell line. Cells were either transfected with a nontargeting siRNA (siCtrl) or Atoh1-targeting siRNAs (siAtoh1-1–siAtoh1-3). Error bars reflect SEM of three technical replicates. (D) MTT assay performed on B837TX1-2 cell line either mock-transfected (Mock), transfected with a nontargeting siRNA (siCtrl), or transfected with Atoh1-targeted siRNAs (siAtoh1-1–siAtoh1-3). Data are graphed relative to the mock-transfected cell line. Absorbance measured at 540 nm (A540). Error bars reflect SEM of three biological replicates.
Figure 8.
Figure 8.
Hic1 is epistatic to Atoh1. (A) Quantitative PCR tracking Hic1 expression in cultured GCPs for 9 d. Gene expression is relative to fresh GCPs. Error bars reflect SEM of three biological replicates. (B) Quantitative PCR tracking Atoh1 and Hic1 expression in cultured GCPs restricted to the first 4 d of culture. Gene expression is relative to fresh GCPs. Error bars reflect SEM of three biological replicates. (C) Quantitative PCR tracking Atoh1 expression in GCPs cultured for 4 d in the presence or absence (Untreated) of recombinant mouse Shh (R&D Systems). On Day 1, cells were either transduced with a Hic1-expressing adenovirus (Hh + AdHic1) or a β-galactosidase-expressing adenovirus (Hh + AdControl), or no adenovirus (rmShh). Gene expression is relative to fresh GCPs. Error bars reflect SEM of three biological replicates.
Figure 9.
Figure 9.
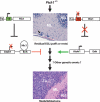
A model for tumorigenesis. (Arrow) Residual EGL occurs in the setting of Ptch1 heterozygosity. Unmethylated Hic1 (green promoter 1b) allows for Hic1 expression. Hic1 binds the Atoh1 enhancer leading to transcriptional repression and differentiation, which depletes the presumed precursor lesion. If Hic1 is hypermethylated (red promoter 1b), expression is silenced leading to uncontrolled Atoh1 expression and tumorigenesis is promoted as demonstrated by a representative image of a Ptch1+/− Hic1+/− tumor. (IGL) Internal granule cell layer; (ML) molecular layer; (Tu) medulloblastoma.

Similar articles

Cited by

References

    1. Bar E.E., Chaudhry A., Farah M.H., Eberhart C.G. Hedgehog signaling promotes medulloblastoma survival via Bc/II. Am. J. Pathol. 2007;170:347–355. - PMC - PubMed
    1. Batra S.K., McLendon R.E., Koo J.S., Castelino-Prabhu S., Fuchs H.E., Kirscher J.P., Friedman H.S., Bigner D.D., Bigner S.H. Prognostic implications of chromosome 17p deletions in human medulloblastomas. J. Neurooncol. 1995;24:39–45. - PubMed
    1. Ben-Arie N., Bellen H.J., Armstrong D.L., McCall A.E., Gordadze P.R., Guo Q., Matzuk M.M., Zoghbi H.Y. Math1 is essential for genesis of cerebellar granule neurons. Nature. 1997;390:169–172. - PubMed
    1. Ben-Arie N., Hassan B.A., Bermingham N.A., Malicki D.M., Armstrong D., Matzuk M., Bellen H.J., Zoghbi H.Y. Functional conservation of atonal and Math1 in the CNS and PNS. Development. 2000;127:1039–1048. - PubMed
    1. Berman D.M., Karhadkar S.S., Hallahan A.R., Pritchard J.I., Eberhart C.G., Watkins D.N., Chen J.K., Cooper M.K., Taipale J., Olson J.M., et al. Medulloblastoma growth inhibition by hedgehog pathway blockade. Science. 2002;297:1559–1561. - PubMed

Publication types

MeSH terms