. 2008 Mar;13(3):221-34.
doi: 10.1016/j.ccr.2008.01.031.

The inhibition of tumor cell intravasation and subsequent metastasis via regulation of in vivo tumor cell motility by the tetraspanin CD151

Affiliations

The inhibition of tumor cell intravasation and subsequent metastasis via regulation of in vivo tumor cell motility by the tetraspanin CD151

Andries Zijlstra et al. Cancer Cell. 2008 Mar.

Abstract

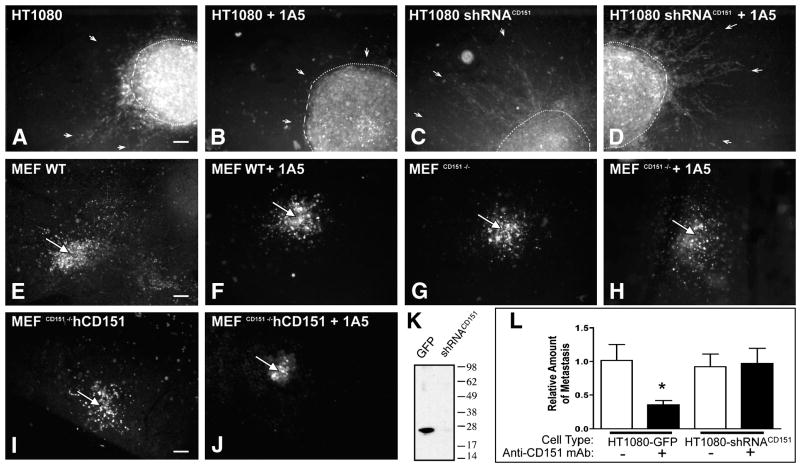
In vivo tumor cell migration through integrin-dependent pathways is key to the metastatic behavior of malignant cells. Using quantitative in vivo assays and intravital imaging, we assessed the impact of cell migration, regulated by the integrin-associated tetraspanin CD151, on spontaneous human tumor cell metastasis. We demonstrate that promoting immobility through a CD151-specific metastasis blocking mAb prevents tumor cell dissemination by inhibiting intravasation without affecting primary tumor growth, tumor cell arrest, extravasation, or growth at the secondary site. In vivo, this loss of migration is the result of enhanced tumor cell-matrix interactions, promoted by CD151, which prevent dissociation by individual cells and leads to a subsequent inhibition of invasion and intravasation at the site of the primary tumor.


Figures

Figure 1
Figure 1. Treatment with anti-CD151 antibody (mAb 1A5) inhibits spontaneous metastasis of human tumor cells in vivo
A) Control antibody (29-7) or anti-CD151 monoclonal antibody (1A5) was injected i.v. (100 ug) into HEp3 or HT1080 tumor-bearing chick embryos one day after applying the tumor cells. The level of metastasis to the chick lower CAM (LCAM) was determined by human alu PCR after 7 days as described in Materials and Methods. B) To confirm that CD151 also impacts metastasis in another in vivo model, human alu PCR was used to quantify the level of spontaneous metastasis in SCID mice bearing HEp3 tumors in response to systemic treatment (i.v. injection, 100 ug ×2) with mAb 1A5. Values are represented as mean ± SEM.
Figure 2
Figure 2. Anti-CD151 metastasis-blocking mAb 1A5 mediates inhibition of migration independent of the underlying matrix
Transwell migration of HEp3 cells in response to an underlying matrix was assessed in the presence of mAb 1A5 or an unspecific control mAb. Haptotactic migration of HEp3 in response to laminin (LN, A) was assessed during a 16 hr incubation and compared to migration on control (uncoated) filters. B) Comparative summary of 1A5 inhibition of matrix mediated migration by HEp3 on LN, Fibronectin (FN), Vitronectin (VN), Col I, and Collagen type IV (Col IV). Values in A and B are represented as mean ± SEM C) Adhesion of HEp3 cells to collagen type I coated coverslips in the presence of control mAb or mAb 1A5 was visualized using phase contrast microscopy (upper panels). The formation of Paxillin containing focal adhesion complexes on a collagen type I substrata in the presence of a control mAb or mAb 1A5 (lower panels). A 2–3 fold enhancement of paxillin containing focal adhesion complexes was observed in the presence of mAb 1A5. Bars = 10μm.
Figure 3
Figure 3. In vivo, intra-stromal tumor cell migration but not the arrest, extravasation, or growth at the secondary site of metastasis is affected by anti-CD151 mAb 1A5
A) The ability of anti-CD151 to impact in vivo mobility was determined by visualizing the intrastromal mobility of GFP-expressing HEp3 (upper panels) and HT1080 (lower panels) cells in the CAM when co-injected with 100μg anti-CD151 or a control IgG. Blood containing vessels are seen in black while GFP-expressing cells are bright green against the dull green glow of the eggshell. Each image is representative of twelve animals imaged in 4 separate experiments. B) Alterations in the ability of tumor cells to arrest, extravasate, and colonize were assessed by confocal imaging of GFP-expressing HEp3 (Green) cells in CAM with Lectin labeled vasculature (Red). Tumor cells coinjected with anti-CD151 or control IgG were imaged at 24hr and 5 days post injection. Merged topical view and vertical projection of a re-sliced Z-stack taken from a selected area (white box) illustrate the location of tumor cells relative to the vasculatrure. Tumor cells which remain inside the vasculature would be seen as yellow while extravasated cells are only seen in green (for further detail see Suppl. Fig. S2). Included images are representative of twelve animals from 4 separate experiments. C) Alu PCR analysis of experimental metastasis was used to quantify the affect of inhibited tumor cell migration on arrest (Day 1) and growth (Day 4) in the lung and the lower CAM (LCAM). HEp3 tumor cells (50,000) were injected into the allantoic vein of a 10 day old chick embryo. Tissue was harvested 3 hr after injection to quantify the number of arrested tumor cells or at 4 days after injection to assess the growth of the arrested cells. Similar results were obtained in 3 experiments. N=5. Values in C are represented as mean ± SEM. Bars in A = 200μm, in B = 20μm.
Figure 4
Figure 4. The inhibition of migration prevents tumor cell invasion at the tumor-stroma interface
GFP-expressing HEp3 and HT1080 CAM tumors were imaged intra-vitally using a newly developed intravital imaging system (see Materials and Methods) to visualize the invasive behavior of metastatic tumor cells. Chick embryos were injected i.v. with 100μg of mAb 1A5 or control mAb 24 hr after CAM implantation of GFP-expressing HEp3 cells. Images were taken 7 days after antibody treatment. The included images are representative of 10 individual tumors generated in 2 separate experiments with 5 animals each. Bars = 800μm (40×) and 100 μm (100×).
Figure 5
Figure 5. Tumor cell motility is inhibited at the tumor-stroma interface in mAb 1A5 treated animals
GFP-expressing HEp3 tumor cells were imaged intra-vitally for 12.25 hr in order to visualize, record and quantify the in vivo motility of individual tumor cell (see materials and methods). Antibody treatment was given i.v. 24 hrs after tumor cell implantation and imaging was initiated 48 hr later. Images were captured every 15 minutes. The motility of tumor cells in a tumor developing on a control animal (A) and a mAb 1A5-treated animal (B) is represented by comparing the first frame (0.00hr) and the last frame (12.25hr) of a 12.25 hr Video (see Suppl. Video V1 (control) and V2 (mAb 1A5)). The migration of individual cells is visualized as an overlay of dots and lines in each frame (left panels). The tracks of 10 representative cells are plotted in Wind-rose plots (right panels) with the initial position of each track superimposed at 0,0 to provide a relative overview of the migration tracks with a single point of origin. The temporal increase in the productive motility of 4 representative tracks from control and treated tumors are plotted in C). The most motile cell in the mAb 1A5 treated tumor (#5) is still far less motile than the average control cells. (D) The motility parameters were determined quantitatively for cells in a tumor from animals treated with either control mAb or mAb 1A5. Motility parameters were determined as an average of 30 cells/tumor with 48 measurements/cell. p values were calculated using Student’s t-test. A highly significant reduction in forward motility but no change in the ability to alter direction (turn angle) is apparent. Values are presented as mean ± SEM and representative of 3 distinct experiments. Scale bars in A and B = 100μm.
Figure 6
Figure 6. Anti-CD151 mediated inhibition of migration coincides with incomplete detachment at the rear of the cells
Selected fields from real-time movies were captured, enhanced and processed to reveal the details of migration in the three-dimensional stroma of tumor-bearing animals treated with control mAb (A) or anti-CD151 mAb 1A5 (B). Also see Suppl. Video V3, V4, V5, and V6. A white arrow indicates the leading edge of the migrating cell and a white arrow-head indicates the trailing end of the same cell. The scale bare is 20μm and the time is marked on each frame. Note that, due to the differential in migration rates, the time line for the control cells is 0.5 hr/frame while the 1A5-treated cells are shown at 1.25hr/frame. Anti-CD151 induced loss of detachment was confirmed in vitro by visualization (C) and quantitation (D) of HEp3 cell migration on a collagen monolayer (200×, large arrow indicates start position of the rear and small arrow indicates the protrusive edge. Also see Suppl. Video V9). The impact on invasion was assessed in vitro using HEp3 cultivated in 3-dimensional collagen (E) where the loss of invasion (white arrow, left panel) and the formation of compact circular colonies was evident (right panel). Scale bars = 20μm (A, B and C) and 10μm (E).
Figure 7
Figure 7. Anti-CD151 mAb ligation promotes immobility while the loss of CD151 fails to impact in vivo motility
The necessity of CD151 expression for in vivo motility of tumor cells and MEF was assessed by implanting fluorescently labeled cells with reduced or ablated CD151 expression into the CAM and determining their ability to depart the implantation site. The ability of HT1080 cells stably transduced with an expression vector containing GFP (HT1080) or CD151 specific shRNA (HT1080 shRNACD151) to migrate out as individual cells was assessed in the presence of control antibody (A and C) or anti-CD151 mAb 1A5 (B and D) at 4 days after tumor cell implantation. The white dotted line demarks the border of the primary tumor while arrows indicate the stromal invasion of tumor cells. Likewise, the inability of anti-CD151 mAb 1A5 to prevent individual wild type MEF (E and F, MEF wt) and CD151 knockout MEF (G and H, MEFCD151−/−) from mobilizing, departing the implantation site and entering the stroma was illustrated by fluorescent microscopy 4 days after implantation. Similarly, the mobility of MEFCD151−/− reconstituted with hCD151 (I, MEFCD151−/− hCD151) was assessed in the CAM. To illustrate the ability of anti-CD151 to actively promote immobility, the ability of MEFCD151−/− hCD151 to disseminate from the implantation site was determined in the presence of mAb 1A5 (J). Each image is representative of 3 individual experiments with 3 animals each. A white arrow (E–J) indicates the injection site. Down-regulation of endogenous CD151 in HT1080 shRNACD151 is confirmed by Western blotting of whole cell lysates with anti-CD151 antibody (K). The impact of ablated CD151 expression on metastasis and the specificity of anti-CD151 treatment was further investigated by quantifying metastasis of HT1080 GFP or shRNACD151 in the presence or absence of anti-CD151 mAb 1A5 (L, Values represent the mean ± SEM where N=8). Scale bars =200μm.
Figure 8
Figure 8. Function blocking anti-CD151 antibody (mAb 1A5) inhibits tumor cell intravasation
A) Intravasation in animals treated i.v. on day 1 with mAb 1A5 or control mAb (mAb 29-7) as determined by alu PCR. The dashed line indicates the number of cells expected on day 6 based upon the growth (24 hr doubling time) of cells detected on day 5. The bar volume above the dashed line represent the number of intravasated cells. Similar results were obtained in 3 experiments. N=6. B) To assess the immediate impact of mAb 1A5-arrested intravasation on metastasis, HEp3 tumor bearing animals were injected 24 hr prior to harvesting the LCAM. The number of intravastated tumor cells in CAM tissue harvested on day 6 after a mAb treatment on day 5 was compared with the number of cells found in day 6 CAM from untreated animals. Values are represented as mean ± SEM. * P ≤ 0.01, ** P ≤ 0.001 Tumor sizes: A) Control: D5 143.5 ± 61, D6 216 ± 100, mAb 1A5: D5 167 ± 72, D6 200 ± 85. B) D5 115 ± 40, Control D6 200 ± 66, mAb 1A5: D6 191 ± 71

Similar articles

Cited by

References

    1. ANG J, LIJOVIC M, ASHMAN LK, KAN K, FRAUMAN AG. CD151 protein expression predicts the clinical outcome of low-grade primary prostate cancer better than histologic grading: a new prognostic indicator? Cancer Epidemiol Biomarkers Prev. 2004;13:1717–21. - PubMed
    1. BERNARDS R, WEINBERG RA. A progression puzzle. Nature. 2002;418:823. - PubMed
    1. BIENSTOCK RJ, BARRETT JC. KAI1, a prostate metastasis suppressor: prediction of solvated structure and interactions with binding partners; integrins, cadherins, and cell-surface receptor proteins. Mol Carcinog. 2001;32:139–53. - PubMed
    1. BISSELL MJ, LABARGE MA. Context, tissue plasticity, and cancer: are tumor stem cells also regulated by the microenvironment? Cancer Cell. 2005;7:17–23. - PMC - PubMed
    1. BOCKHORN M, JAIN R, MUNN L. Active versus passive mechanisms in metastasis: do cancer cells crawl into vessels, or are they pushed? Lancet Oncol. 2007;8:444–8. - PMC - PubMed

Publication types

MeSH terms