. 2008 Jul;19(7):1311-20.
doi: 10.1681/ASN.2007091040. Epub 2008 Mar 5.

Epigenetic regulation of BMP7 in the regenerative response to ischemia

Affiliations

Epigenetic regulation of BMP7 in the regenerative response to ischemia

Takeshi Marumo et al. J Am Soc Nephrol. 2008 Jul.

Abstract

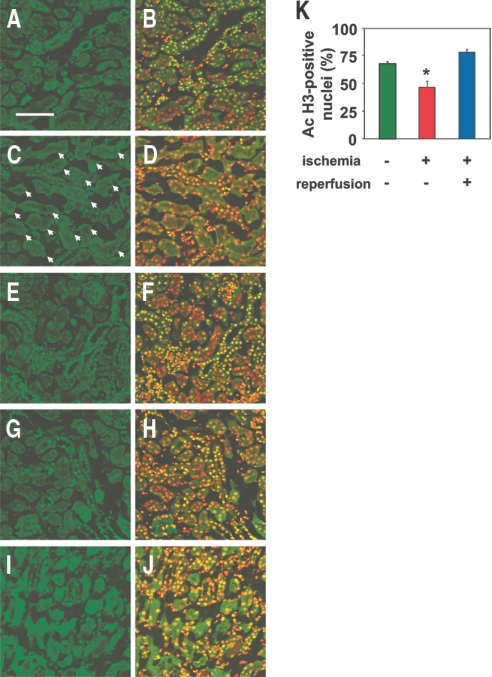
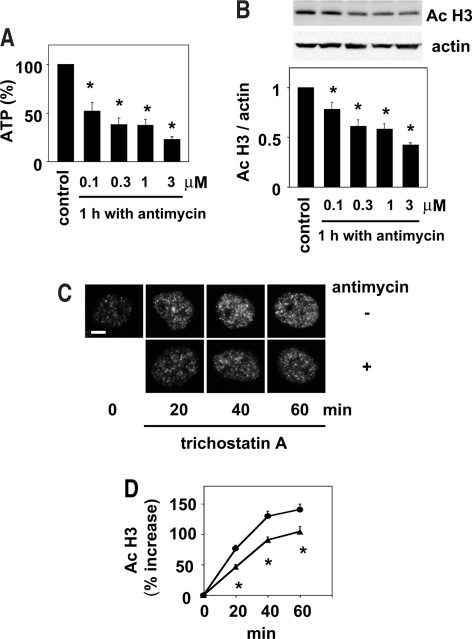
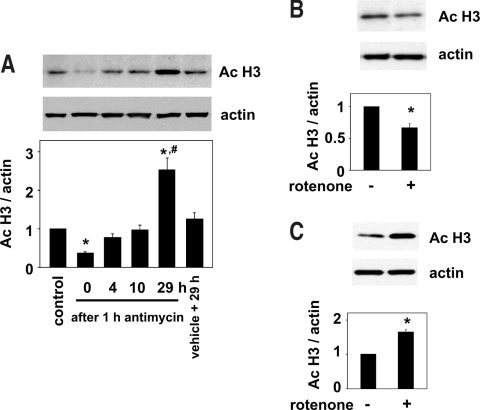
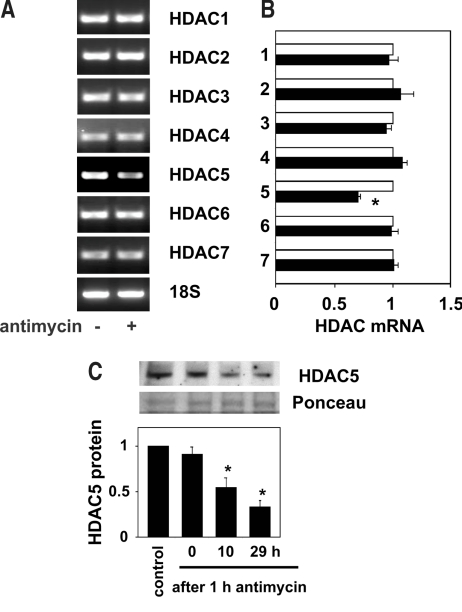
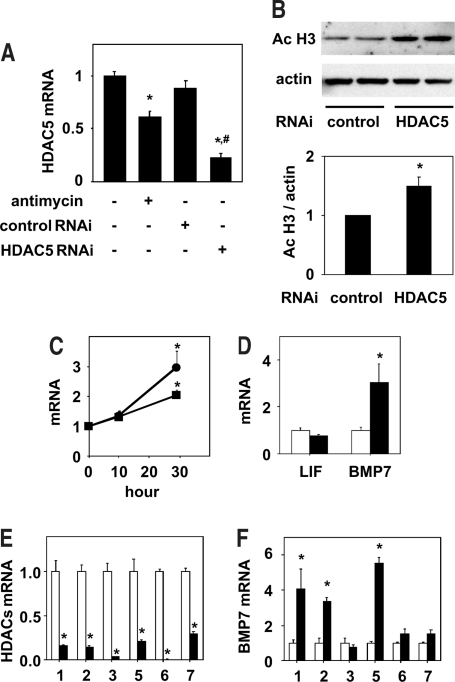
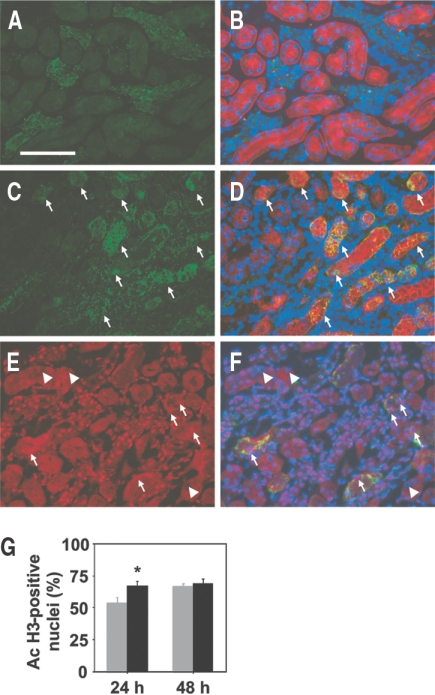
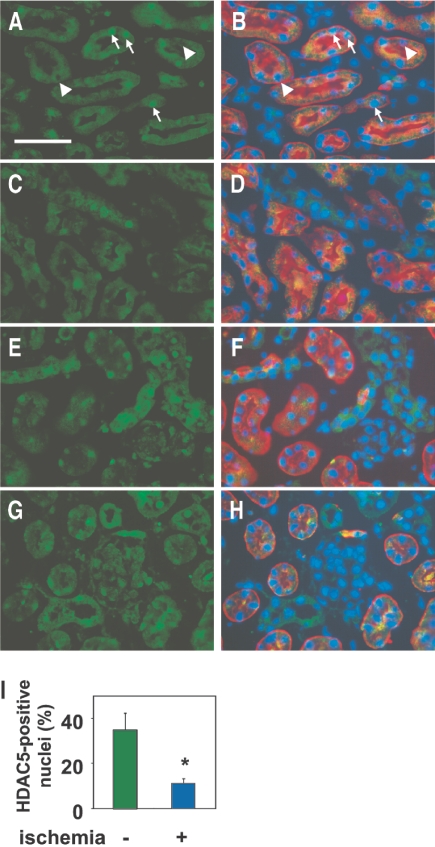
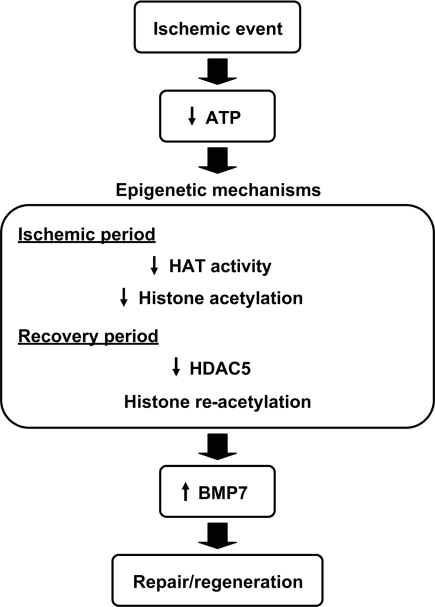
Kidneys damaged by ischemia have the potential to regenerate through a mechanism involving intrarenal induction of protective factors, including bone morphogenetic protein-7 (BMP7). Epigenetic changes, such as alterations in histone modifications, have also been shown to play a role in various pathologic conditions, but their involvement in ischemic injury and regeneration remains unknown. This study investigated whether changes in histone acetylation, regulated by histone acetyltransferase and histone deacetylase (HDAC), are induced by renal ischemia and involved in the regenerative response. Ischemia/reperfusion of the mouse kidney induced a transient decrease in histone acetylation in proximal tubular cells, likely as a result of a decrease in histone acetyltransferase activity as suggested by experiments with energy-depleted renal epithelial cells in culture. During recovery after transient energy depletion in epithelial cells, the HDAC isozyme HDAC5 was selectively downregulated in parallel with the return of acetylated histone. Knockdown of HDAC5 by RNAi significantly increased histone acetylation and BMP7 expression. BMP7 induction and HDAC5 downregulation in the recovery phase were also observed in proximal tubular cells in vivo after transient ischemia. These data indicate that ischemia induces dynamic epigenetic changes involving HDAC5 downregulation, which contributes to histone re-acetylation and BMP7 induction in the recovery phase. This highlights HDAC5 as a modulator of the regenerative response after ischemia and suggests HDAC5 inhibition may be a therapeutic strategy to enhance BMP7 expression.


Figures

Figure 1.
Figure 1.
Reversible decrease in histone acetylation after ischemia. (A through H) Immunohistochemical staining of the renal outer medulla (A through D) and cortex (E through H) from nonischemic (A, B, E, and F) and ischemic (C, D, G, and H) kidneys with acetylated histone (green) immediately after 40 min of ischemia. Localization of nuclei in the same sections A, C, E, and G is shown by co-staining with TOPRO-3 (red) in B, D, F, and H, respectively. Bar = 100 μm. The proximal tubules stained negative for acetylated histone are shown by arrows in C. (I and J) Immunohistochemical staining of the renal outer medulla of the ischemic kidney with acetylated histone (green) 24 h after ischemia/reperfusion. Localization of nuclei in the same section I is shown by co-staining with TOPRO-3 (red) in J. Results are from representative sections of four mice in each group. (K) Quantitative analysis of nuclei positive for acetylated histone in the outer medulla of kidneys is shown. Nonischemic and ischemic kidneys obtained from the mice immediately after 40 min of ischemia and ischemic kidneys 24 h after ischemia/reperfusion were analyzed. Data are mean percentage of total nuclei ± SEM (n = 4). *P < 0.05 versus values without ischemia.
Figure 2.
Figure 2.
Energy depletion reduces histone acetylation via decreased in situ HAT activity in the renal tubular cells. (A) NRK 52E cells were incubated with or without (control) various concentrations of antimycin A (0.1 to 3 μM) for 1 h, and the cellular ATP levels were determined. Values normalized to the levels in the control are means ± SEM (n = 5). *P < 0.05 versus control values. (B) NRK 52E cells were incubated with or without (control) various concentrations of antimycin A (0.1 to 3 μM) for 1 h, and Western blot analysis of acetylated histone was performed. Representative films of Western blot analysis for acetylated histone and actin are shown in the top panels. The results of densitometric analysis are shown in the bottom panel. Data are means ± SEM (n = 4). *P < 0.05 versus control values. (C) Representative immunofluorscent images of NRK 52E cell nuclei stained with acetylated histone 0, 20, 40, or 60 min after the addition of trichostatin A (300 nM), the HDAC inhibitor, in the presence or absence of antimycin A (1 μM). Bar = 3 μm. (D) The signal intensity of acetylated histone from at least 40 cells for each condition described in C was obtained by laser confocal microscopy. Increases in the signals from the baseline (time 0) with (▴) or without (•) antimycin A were calculated and presented as means ± SEM (n = 40). The signals at the baseline were defined as 100%. *P < 0.05 versus values without antimycin A at each time point.
Figure 3.
Figure 3.
Time-dependent changes in histone acetylation after transient energy depletion. (A) After 1 h of treatment with antimycin A (1 μM), NRK 52E cells were incubated in the maintenance medium for the recovery of ATP. After various incubation periods up to 29 h, the cells were harvested and Western blot analysis was performed. Control denotes cells harvested before incubation with antimycin A. Cells harvested 29 h after incubation in the maintenance medium after treatment with vehicle instead of antimycin A for 1 h were also analyzed (vehicle + 29h). Representative films of Western blot analysis for acetylated histone and actin are shown in the top panels. The results of densitometric analysis are shown in the bottom panel. Data are means ± SEM (n = 3). *P < 0.05 versus control values; #P < 0.05 versus values with vehicle + 29h. (B) NRK 52E cells were incubated with or without rotenone (10 μM) for 1 h, and Western blot analysis was performed. Representative films of Western blot analysis for acetylated histone and actin are shown in the top panels. The results of densitometric analysis are shown in the bottom panel. Data are means ± SEM (n = 6). *P < 0.05 versus values without rotenone. (C) After 1 h of treatment with or without rotenone (10 μM), NRK 52E cells were incubated in the maintenance medium for 29 h, and Western blot analysis was performed. Representative films of Western blot analysis for acetylated histone and actin are shown in the top panels. The results of densitometric analysis are shown in the bottom panel. Data are means ± SEM (n = 3). *P < 0.05 versus values without rotenone.
Figure 4.
Figure 4.
Downregulation of HDAC5 after transient energy depletion. (A and B) After 1 h of incubation with or without antimycin A (1 μM), NRK 52E cells were incubated in the maintenance medium for 29 h, and the HDAC mRNA and 18S ribosomal RNA levels were analyzed by semiquantitative RT-PCR. Representative agarose gels are shown in A. Values obtained by densitometric analysis of RT-PCR for HDAC with (▪) or without (□) antimycin A treatment were normalized to those for 18S and expressed as relative values to those obtained without antimycin A in B. Data are means ± SEM (n = 4 to 6). *P < 0.05 versus values without antimycin A. (C) Nuclear HDAC5 protein levels were determined by Western blot analysis in NRK 52E cells before exposure to antimycin A (control), after treatment with antimycin A for 1 h, and after 10 and 29 h of incubation in the maintenance medium after 1 h of exposure to antimycin A. Representative films of Western blot analysis for HDAC5 and Ponceau S staining of the membrane before Western blotting are shown in the top panels. The results of densitometric analysis are shown in the bottom panel. Data are means ± SEM (n = 4). *P < 0.05 versus control values.
Figure 5.
Figure 5.
HDAC5 knockdown increases histone acetylation and BMP7 mRNA expression. (A) After 1 h of treatment with or without antimycin A (1 μM), NRK 52E cells were incubated in the maintenance medium for 29 h, and the HDAC5 mRNA levels were analyzed by real-time RT-PCR. Cells for the knockdown experiments were treated with control or HDAC5 Stealth RNAi for 24 h before the 1-h treatment with PBS-based medium and the subsequent incubation in maintenance medium for 29 h. Data are means ± SEM (n = 7 to 8). *P < 0.05 versus values without antimycin A or Stealth RNAi; #P < 0.05 versus values with control Stealth RNAi. (B) The levels of acetylated histone in NRK 52E cells treated with control or HDAC5 Stealth RNAi as described in A were determined by Western blot analysis. Representative films of Western blot analysis for acetylated histone and actin are shown in the top panels. The results of densitometric analysis are shown in the bottom panel. Data are means ± SEM (n = 4). *P < 0.05 versus values with control RNAi. (C) Time-dependent increase in LIF and BMP7 mRNA after transient energy depletion. The levels of LIF (▪) and BMP7 (•) mRNA in NRK 52E cells treated with antimycin A as described in A and incubated in the maintenance medium for 10 and 29 h were determined by real time RT-PCR analysis. Data are means ± SEM (n = 4). Time 0 denotes a group of cells before exposure to antimycin A. *P < 0.05 versus values without antimycin A. (D) The levels of LIF and BMP7 mRNA in NRK 52E cells treated with control (□) or HDAC5 (▪) Stealth RNAi as described in A were determined by real time RT-PCR analysis. Data are means ± SEM (n = 8 to 9). *P < 0.05 versus values with control RNAi. (E and F) NRK 52E cells were incubated with control (□) or HDAC isozyme (▪) Stealth RNAi for 48 h. For HDAC5 knockdown, second HDAC5 RNAi was used. The mRNA levels of each HDAC isozyme (E) and BMP7 (F) were determined by real-time RT-PCR. Data are means ± SEM (n = 4). *P < 0.05 versus control values.
Figure 6.
Figure 6.
Induction of BMP7 and recovery of acetylated histone in the proximal tubular cells of the outer medulla in the recovery phase after ischemia. Immunohistochemical staining of the renal outer medulla from nonischemic (A and B) and ischemic (C and D) kidneys for BMP7 (green) at 48 h after ischemia/reperfusion. Localization of the proximal tubules and nuclei of the same sections A and C is shown by co-staining with Lotus tetragonolobus (red), a marker of proximal tubular cells, and DAPI (blue) in B and D, respectively. The proximal tubules with BMP7 induction after ischemia/reperfusion are indicated by arrows in C and D. Bar = 100 μm. Immunohistochemical staining of the renal outer medulla from ischemic (E and F) kidneys for acetylated histone (red) at 24 h after ischemia/reperfusion. Localization of nuclei (TOPRO-3, blue) and BMP7-positive tubules (green) in the same section E is shown by co-staining in F. Results are from representative sections of four mice in each group. Nuclei positive for acetylated histone (arrows) appear purple in F, whereas those negative for acetylated histone (arrowheads) remain blue in F. (G) Quantitative analysis of nuclei positive for acetylated histone in the proximal tubular cells with (▪) and without (□) BMP7 induction is shown. The proximal tubular cells in the outer medulla of ischemic kidneys obtained from the mice 24 and 48 h after ischemia/reperfusion were analyzed. Data are mean percentage of total nuclei of the proximal tubular cells with or without BMP7 induction ± SEM (n = 4). *P < 0.05 versus values without BMP7 induction.
Figure 7.
Figure 7.
Decreased nuclear HDAC5 expression in the recovery phase after ischemia. Immunohistochemical staining of the renal outer medulla (A through D) and cortex (E through H) from nonischemic (A, B, E, and F) and ischemic (C, D, G, and H) kidneys for HDAC5 (green) at 48 h after ischemia/reperfusion. Localization of the proximal tubules and nuclei of the same sections A, C, E, and G is shown by co-staining with Lotus tetragonolobus (red) and DAPI (blue) in B, D, F, and H, respectively. Nuclei positive for HDAC5 appear light blue (arrows), whereas those negative for HDAC5 appear dark blue (arrowheads), as shown in B. Most of nuclei of the proximal tubular cells are negative for HDAC5 in D. Bar = 50 μm. Results are from representative sections of four mice in each group. (I) Quantitative analysis of HDAC5-positive nuclei of the proximal tubules in the outer medulla from kidneys with and without ischemia is shown. Data are mean percentage of total nuclei of the proximal tubular cells ± SEM (n = 4). *P < 0.05 versus values without ischemia.
Figure 8.
Figure 8.
Model showing the proposed role of epigenetic mechanisms in ischemia and the subsequent response in the kidney. In response to ischemia, the levels of acetylated histone decrease in the proximal tubular cells, probably as a result of the decreased in situ HAT activity. After reperfusion, the levels of acetylated histone recover in part through HDAC5 downregulation. Decreased levels of HDAC5 contribute to the induction of BMP-7 in the proximal tubules, which may be involved in the regeneration of renal tubules.

Similar articles

Cited by

References

    1. Bolden JE, Peart MJ, Johnstone RW: Anticancer activities of histone deacetylase inhibitors. Nat Rev Drug Discov 5: 769–784, 2006 - PubMed
    1. Bernstein BE, Meissner A, Lander ES: The mammalian epigenome. Cell 128: 669–681, 2007 - PubMed
    1. Reik W: Stability and flexibility of epigenetic gene regulation in mammalian development. Nature 447: 425–432, 2007 - PubMed
    1. Seligson DB, Horvath S, Shi T, Yu H, Tze S, Grunstein M, Kurdistani SK: Global histone modification patterns predict risk of prostate cancer recurrence. Nature 435: 1262–1266, 2005 - PubMed
    1. Backs J, Olson EN: Control of cardiac growth by histone acetylation/deacetylation. Circ Res 98: 15–24, 2006 - PubMed

Publication types

MeSH terms

LinkOut - more resources