Coordination of growth and endoplasmic reticulum stress signaling by regulator of calcineurin 1 (RCAN1), a novel ATF6-inducible gene
- PMID: 18319259
- PMCID: PMC2376224
- DOI: 10.1074/jbc.M709776200
Coordination of growth and endoplasmic reticulum stress signaling by regulator of calcineurin 1 (RCAN1), a novel ATF6-inducible gene
Abstract
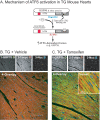
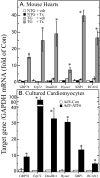
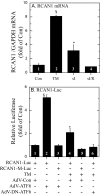
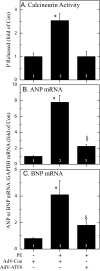
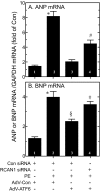
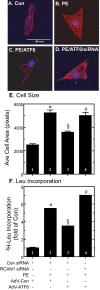
Exposing cells to conditions that modulate growth can impair endoplasmic reticulum (ER) protein folding, leading to ER stress and activation of the transcription factor, ATF6. ATF6 binds to ER stress response elements in target genes, inducing expression of proteins that enhance the ER protein folding capacity, which helps overcome the stress and foster survival. To examine the mechanism of ATF6-mediated survival in vivo, we developed a transgenic mouse model that expresses a novel conditionally activated form of ATF6. We previously showed that activating ATF6 protected the hearts of ATF6 transgenic mice from ER stresses. In the present study, transcript profiling identified modulatory calcineurin interacting protein-1 (MCIP1), also known as regulator of calcineurin 1 (RCAN1), as a novel ATF6-inducible gene that encodes a known regulator of calcineurin/nuclear factor of activated T cells (NFAT)-mediated growth and development in many tissues. The ability of ATF6 to induce RCAN1 in vivo was replicated in cultured cardiac myocytes, where adenoviral (AdV)-mediated overexpression of activated ATF6 induced the RCAN1 promoter, up-regulated RCAN1 mRNA, inhibited calcineurin phosphatase activity, and exerted a striking growth modulating effect that was inhibited by RCAN1-targeted small interfering RNA. These results demonstrate that RCAN1 is a novel ATF6 target gene that may coordinate growth and ER stress signaling pathways. By modulating growth, RCAN1 may reduce the need for ER protein folding, thus helping to overcome the stress and enhance survival. Moreover, these results suggest that RCAN1 may also be a novel integrator of growth and ER stress signaling in many other tissues that depend on calcineurin/NFAT signaling for optimal growth and development.
Figures
Similar articles
-
ATF6 Decreases Myocardial Ischemia/Reperfusion Damage and Links ER Stress and Oxidative Stress Signaling Pathways in the Heart.Circ Res. 2017 Mar 3;120(5):862-875. doi: 10.1161/CIRCRESAHA.116.310266. Epub 2016 Dec 8. Circ Res. 2017. PMID: 27932512 Free PMC article.
-
Regulator of calcineurin 1 controls growth plasticity of adult pancreas.Gastroenterology. 2010 Aug;139(2):609-19, 619.e1-6. doi: 10.1053/j.gastro.2010.04.050. Epub 2010 Jun 18. Gastroenterology. 2010. PMID: 20438729 Free PMC article.
-
Endoplasmic reticulum stress gene induction and protection from ischemia/reperfusion injury in the hearts of transgenic mice with a tamoxifen-regulated form of ATF6.Circ Res. 2006 May 12;98(9):1186-93. doi: 10.1161/01.RES.0000220643.65941.8d. Epub 2006 Apr 6. Circ Res. 2006. PMID: 16601230
-
Roles for ATF6 and the sarco/endoplasmic reticulum protein quality control system in the heart.J Mol Cell Cardiol. 2014 Jun;71:11-5. doi: 10.1016/j.yjmcc.2013.09.018. Epub 2013 Oct 16. J Mol Cell Cardiol. 2014. PMID: 24140798 Free PMC article. Review.
-
Chronic high levels of the RCAN1-1 protein may promote neurodegeneration and Alzheimer disease.Free Radic Biol Med. 2013 Sep;62:47-51. doi: 10.1016/j.freeradbiomed.2013.01.016. Epub 2013 Jan 29. Free Radic Biol Med. 2013. PMID: 23369757 Free PMC article. Review.
Cited by
-
ATF6 Decreases Myocardial Ischemia/Reperfusion Damage and Links ER Stress and Oxidative Stress Signaling Pathways in the Heart.Circ Res. 2017 Mar 3;120(5):862-875. doi: 10.1161/CIRCRESAHA.116.310266. Epub 2016 Dec 8. Circ Res. 2017. PMID: 27932512 Free PMC article.
-
Cardiomyokines from the heart.Cell Mol Life Sci. 2018 Apr;75(8):1349-1362. doi: 10.1007/s00018-017-2723-6. Epub 2017 Dec 13. Cell Mol Life Sci. 2018. PMID: 29238844 Free PMC article. Review.
-
ER Stress-Sensor Proteins and ER-Mitochondrial Crosstalk-Signaling Beyond (ER) Stress Response.Biomolecules. 2021 Jan 28;11(2):173. doi: 10.3390/biom11020173. Biomolecules. 2021. PMID: 33525374 Free PMC article. Review.
-
Metabolic dysfunction in pulmonary hypertension: the expanding relevance of the Warburg effect.Eur J Clin Invest. 2013 Aug;43(8):855-65. doi: 10.1111/eci.12104. Epub 2013 Apr 26. Eur J Clin Invest. 2013. PMID: 23617881 Free PMC article. Review.
-
Activating Transcription Factor 6 Contributes to Functional Recovery After Spinal Cord Injury in Adult Zebrafish.J Mol Neurosci. 2021 Apr;71(4):734-745. doi: 10.1007/s12031-020-01691-9. Epub 2020 Sep 7. J Mol Neurosci. 2021. PMID: 32895880
References
Publication types
MeSH terms
Substances
Grants and funding
LinkOut - more resources
Full Text Sources
Molecular Biology Databases
Research Materials

