

Activation of D-tyrosine by Bacillus stearothermophilus tyrosyl-tRNA synthetase: 1. Pre-steady-state kinetic analysis reveals the mechanistic basis for the recognition of D-tyrosine
- PMID: 18319247
- PMCID: PMC2442314
- DOI: 10.1074/jbc.M801649200
Activation of D-tyrosine by Bacillus stearothermophilus tyrosyl-tRNA synthetase: 1. Pre-steady-state kinetic analysis reveals the mechanistic basis for the recognition of D-tyrosine
Abstract
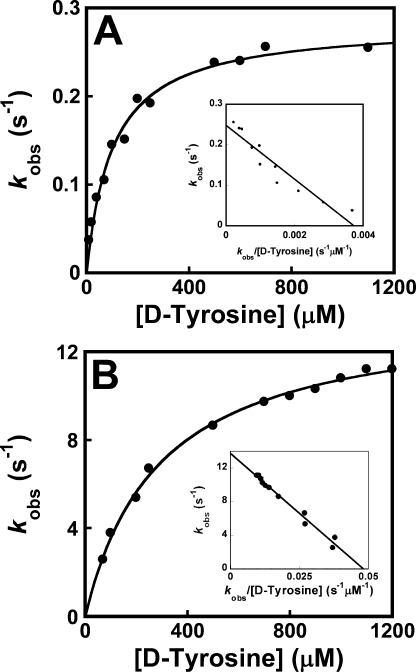
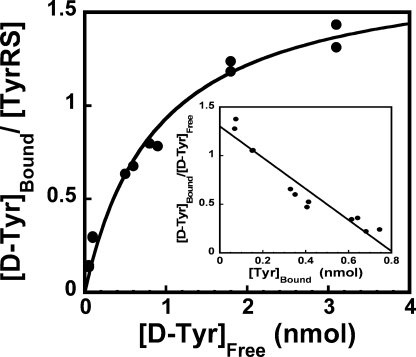
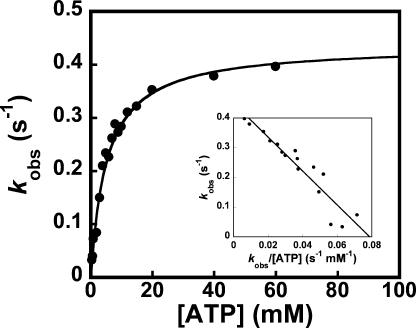
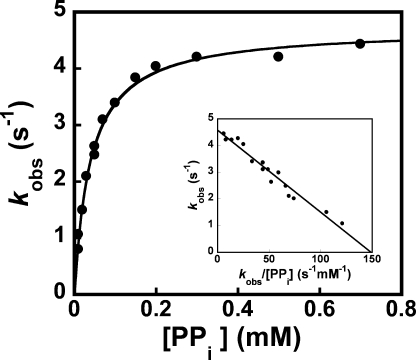
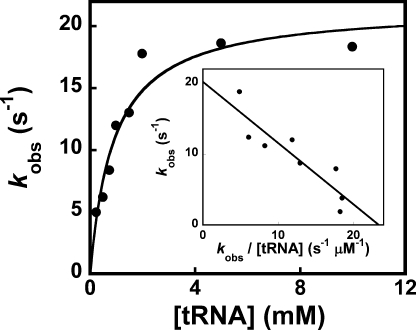
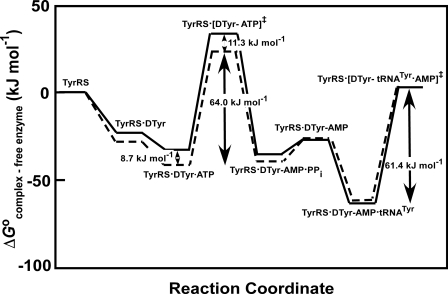
Tyrosyl-tRNA synthetase (TyrRS) is able to catalyze the transfer of both l- and d-tyrosine to the 3' end of tRNA(Tyr). Activation of either stereoisomer by ATP results in formation of an enzyme-bound tyrosyl-adenylate intermediate and is accompanied by a blue shift in the intrinsic fluorescence of the protein. Single turnover kinetics for the aminoacylation of tRNA(Tyr) by D-tyrosine were monitored using stopped-flow fluorescence spectroscopy. Bacillus stearothermophilus tyrosyl-tRNA synthetase binds d-tyrosine with an 8.5-fold lower affinity than that of l-tyrosine (K (D-Tyr)(d) = 102 microm) and exhibits a 3-fold decrease in the forward rate constant for the activation reaction (k (D-Tyr)(3) = 13 s(-1)). Furthermore, as is the case for l-tyrosine, tyrosyl-tRNA synthetase exhibits "half-of-the-sites" reactivity with respect to the binding and activation of D-tyrosine. Surprisingly, pyrophosphate binds to the TyrRS.d-Tyr-AMP intermediate with a 14-fold higher affinity than it binds to the TyrRS.l-Tyr-AMP intermediate (K (PPi)(d) = 0.043 for TyrRS.d-Tyr-AMP.PP(i)). tRNA(Tyr) binds with a slightly (2.3-fold) lower affinity to the TyrRS.d-Tyr-AMP intermediate than it does to the TyrRS.l-Tyr-AMP intermediate. The observation that the K (Tyr)(d) and k(3) values are similar for l- and d-tyrosine suggests that their side chains bind to tyrosyl-tRNA synthetase in similar orientations and that at least one of the carboxylate oxygen atoms in d-tyrosine is properly positioned for attack on the alpha-phosphate of ATP.
Figures
Similar articles
-
Activation of D-tyrosine by Bacillus stearothermophilus tyrosyl-tRNA synthetase: 2. Cooperative binding of ATP is limited to the initial turnover of the enzyme.J Biol Chem. 2008 May 9;283(19):12971-80. doi: 10.1074/jbc.M801650200. Epub 2008 Mar 4. J Biol Chem. 2008. PMID: 18319246 Free PMC article.
-
Thermodynamic analysis reveals a temperature-dependent change in the catalytic mechanism of bacillus stearothermophilus tyrosyl-tRNA synthetase.J Biol Chem. 2009 Feb 13;284(7):4179-90. doi: 10.1074/jbc.M808500200. Epub 2008 Dec 20. J Biol Chem. 2009. PMID: 19098308 Free PMC article.
-
Stabilization of the transition state for the transfer of tyrosine to tRNA(Tyr) by tyrosyl-tRNA synthetase.J Mol Biol. 2000 Oct 20;303(2):299-310. doi: 10.1006/jmbi.2000.4126. J Mol Biol. 2000. PMID: 11023794
-
Discrimination between transfer-RNAs by tyrosyl-tRNA synthetase.Biochimie. 1993;75(12):1099-108. doi: 10.1016/0300-9084(93)90009-h. Biochimie. 1993. PMID: 8199245 Review.
-
Spectrophotometric assays for monitoring tRNA aminoacylation and aminoacyl-tRNA hydrolysis reactions.Methods. 2017 Jan 15;113:3-12. doi: 10.1016/j.ymeth.2016.10.010. Epub 2016 Oct 22. Methods. 2017. PMID: 27780756 Review.
Cited by
-
Stereospecificity control in aminoacyl-tRNA-synthetases: new evidence of d-amino acids activation and editing.Nucleic Acids Res. 2019 Oct 10;47(18):9777-9788. doi: 10.1093/nar/gkz756. Nucleic Acids Res. 2019. PMID: 31504788 Free PMC article.
-
Widespread distribution of cell defense against D-aminoacyl-tRNAs.J Biol Chem. 2009 May 22;284(21):14096-104. doi: 10.1074/jbc.M808173200. Epub 2009 Mar 30. J Biol Chem. 2009. PMID: 19332551 Free PMC article.
-
Activation of D-tyrosine by Bacillus stearothermophilus tyrosyl-tRNA synthetase: 2. Cooperative binding of ATP is limited to the initial turnover of the enzyme.J Biol Chem. 2008 May 9;283(19):12971-80. doi: 10.1074/jbc.M801650200. Epub 2008 Mar 4. J Biol Chem. 2008. PMID: 18319246 Free PMC article.
-
Identification and characterization of mutations conferring resistance to D-amino acids in Bacillus subtilis.J Bacteriol. 2015 May;197(9):1632-9. doi: 10.1128/JB.00009-15. Epub 2015 Mar 2. J Bacteriol. 2015. PMID: 25733611 Free PMC article.
-
Capture and quality control mechanisms for adenosine-5'-triphosphate binding.J Am Chem Soc. 2013 Apr 24;135(16):6047-55. doi: 10.1021/ja308044w. Epub 2013 Feb 13. J Am Chem Soc. 2013. PMID: 23276298 Free PMC article.
References
-
- Fersht, A. R., Knill-Jones, J. W., Bedouelle, H., and Winter, G. (1988) Biochemistry 27 1581–1587 - PubMed
-
- Avis, J. M., Day, A. G., Garcia, G. A., and Fersht, A. R. (1993) Biochemistry 32 5312–5320 - PubMed
-
- Fersht, A. R., Mulvey, R. S., and Koch, G. L. (1975) Biochemistry 14 13–18 - PubMed
-
- Calendar, R., and Berg, P. (1966) Biochemistry 5 1690–1695 - PubMed
-
- Calendar, R., and Berg, P. (1967) J. Mol. Biol. 26 39–54 - PubMed
Publication types
MeSH terms
Substances
Grants and funding
LinkOut - more resources
Full Text Sources
Other Literature Sources
Miscellaneous
