

Review
doi: 10.1016/j.ymeth.2007.11.007.
Measuring apoptosis at the single cell level
Affiliations
- PMID: 18314052
- PMCID: PMC2423010
- DOI: 10.1016/j.ymeth.2007.11.007
Item in Clipboard
Review
Measuring apoptosis at the single cell level
Methods.
2008 Mar.
Abstract
The use of live cell microscopy has made a number of contributions to the study of apoptosis. Many of the tools and techniques are available that allow us to image the key events that occur during cell death including mitochondrial outer membrane permeabilization, mitochondrial transmembrane potential changes, translocation of Bcl-2 family members, caspase activation, phosphatidylserine flip and plasma membrane rupture. We discuss these techniques here and highlight the advantages and drawbacks of using such approaches to study apoptosis.
Figures
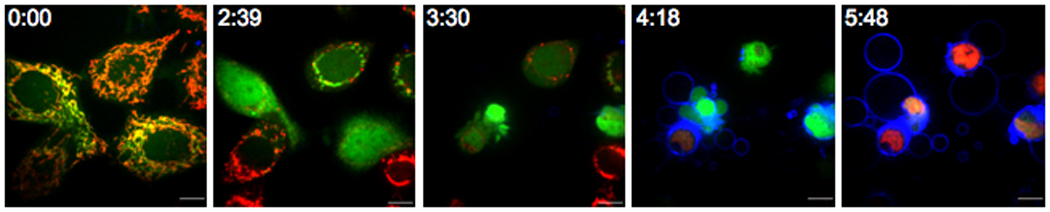
Time-lapse analysis of the morphological changes that occur during apoptosis. Hela cyt c-GFP cells were stained with TMRE (50nM, red), Annexin V-APC (1% (v/v), blue) and PI (0.4µg/ml, pink) and treated with actinomycin D (1µM). The time after exposure to actinomycin D is at the top left of each panel. Scale bars (10µm) are at the bottom right of each panel.
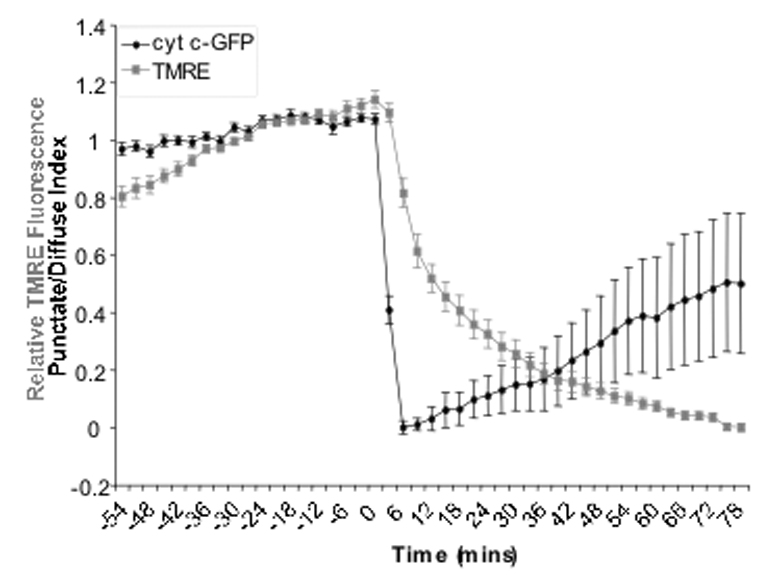
Time-lapse analysis of the relative brightness of TMRE compared to the punctate diffuse index of cytochrome c-GFP. Hela cyt c-GFP cells were exposed to Act D (0.5µM) and the caspase inhibitor qVD-OPH (20µM) for 13 hours. Each point on the graph represents the average punctate/diffuse index or average relative TMRE fluorescence of 32 cells at 3 min intervals. Error bars represent the SEM.
Similar articles
-
A mechanistic view of mitochondrial death decision pores.Braz J Med Biol Res. 2007 Aug;40(8):1011-24. doi: 10.1590/s0100-879x2006005000109. Braz J Med Biol Res. 2007. PMID: 17665037 Review.
-
Caspase-mediated Bak activation and cytochrome c release during intrinsic apoptotic cell death in Jurkat cells.J Biol Chem. 2008 Dec 19;283(51):35532-8. doi: 10.1074/jbc.M807656200. Epub 2008 Oct 15. J Biol Chem. 2008. PMID: 18927073 Free PMC article.
-
Differential effects of Bcl-2 and caspases on mitochondrial permeabilization during endogenous or exogenous reactive oxygen species-induced cell death: a comparative study of H₂O₂, paraquat, t-BHP, etoposide and TNF-α-induced cell death.Cell Biol Toxicol. 2012 Aug;28(4):239-53. doi: 10.1007/s10565-012-9219-9. Epub 2012 Apr 11. Cell Biol Toxicol. 2012. PMID: 22491967
-
Bax/Bak-dependent, Drp1-independent Targeting of X-linked Inhibitor of Apoptosis Protein (XIAP) into Inner Mitochondrial Compartments Counteracts Smac/DIABLO-dependent Effector Caspase Activation.J Biol Chem. 2015 Sep 4;290(36):22005-18. doi: 10.1074/jbc.M115.643064. Epub 2015 Jul 1. J Biol Chem. 2015. PMID: 26134559 Free PMC article.
-
Multiple pathways of cytochrome c release from mitochondria in apoptosis.Biochim Biophys Acta. 2006 May-Jun;1757(5-6):639-47. doi: 10.1016/j.bbabio.2006.03.016. Epub 2006 Apr 19. Biochim Biophys Acta. 2006. PMID: 16678785 Review.
Cited by
-
Progesterone stimulates mitochondrial activity with subsequent inhibition of apoptosis in MCF-10A benign breast epithelial cells.Am J Physiol Endocrinol Metab. 2009 Nov;297(5):E1089-96. doi: 10.1152/ajpendo.00209.2009. Epub 2009 Aug 18. Am J Physiol Endocrinol Metab. 2009. PMID: 19690070 Free PMC article.
-
Bcl-2 proteins regulate ER membrane permeability to luminal proteins during ER stress-induced apoptosis.Cell Death Differ. 2011 Jan;18(1):38-47. doi: 10.1038/cdd.2010.68. Epub 2010 Jun 11. Cell Death Differ. 2011. PMID: 20539308 Free PMC article.
-
NF-kappaB inhibits T-cell activation-induced, p73-dependent cell death by induction of MDM2.Proc Natl Acad Sci U S A. 2010 Oct 19;107(42):18061-6. doi: 10.1073/pnas.1006163107. Epub 2010 Oct 4. Proc Natl Acad Sci U S A. 2010. PMID: 20921405 Free PMC article.
-
Single Degranulations in NK Cells Can Mediate Target Cell Killing.J Immunol. 2018 May 1;200(9):3231-3243. doi: 10.4049/jimmunol.1701500. Epub 2018 Mar 28. J Immunol. 2018. PMID: 29592963 Free PMC article.
-
Methods for imaging mammalian mitochondrial morphology: A prospective on MitoGraph.Anal Biochem. 2018 Jul 1;552:81-99. doi: 10.1016/j.ab.2018.02.022. Epub 2018 Mar 2. Anal Biochem. 2018. PMID: 29505779 Free PMC article.
References
Publication types
MeSH terms
Substances
Grants and funding
LinkOut - more resources
Full Text Sources
Other Literature Sources
