. 2008 Mar 17;205(3):585-94.
doi: 10.1084/jem.20072108. Epub 2008 Feb 25.

Sustained expression of microRNA-155 in hematopoietic stem cells causes a myeloproliferative disorder

Affiliations

Sustained expression of microRNA-155 in hematopoietic stem cells causes a myeloproliferative disorder

Ryan M O'Connell et al. J Exp Med. .

Abstract

Mammalian microRNAs are emerging as key regulators of the development and function of the immune system. Here, we report a strong but transient induction of miR-155 in mouse bone marrow after injection of bacterial lipopolysaccharide (LPS) correlated with granulocyte/monocyte (GM) expansion. Demonstrating the sufficiency of miR-155 to drive GM expansion, enforced expression in mouse bone marrow cells caused GM proliferation in a manner reminiscent of LPS treatment. However, the miR-155-induced GM populations displayed pathological features characteristic of myeloid neoplasia. Of possible relevance to human disease, miR-155 was found to be overexpressed in the bone marrow of patients with certain subtypes of acute myeloid leukemia (AML). Furthermore, miR-155 repressed a subset of genes implicated in hematopoietic development and disease. These data implicate miR-155 as a contributor to physiological GM expansion during inflammation and to certain pathological features associated with AML, emphasizing the importance of proper miR-155 regulation in developing myeloid cells during times of inflammatory stress.


Figures
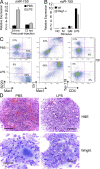
Figure 1.
Figure 1.
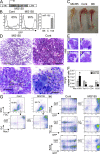
LPS treatment induces bone marrow expression of miR-155 before GM expansion. (A) WT mice (n = 3 per group) were injected i.p. with 50 μg LPS dissolved in PBS or PBS alone. RNA was collected from total bone marrow cells, and miR-155 expression was assayed by quantitative PCR (mean ± SD). (B) Bone marrow was flushed out of the femurs and tibias of WT and Rag1−/− mice (n = 3 per group), stimulated with 100 ng/ml LPS, 100 ng/ml GM-CSF (GM), or medium (M) for 24 h, and RNA was then assayed for miR-155 expression levels (mean ± SD). NC, no template control. (C) BM cells collected from mice in A at the 72-h time point were stained with antibodies against Mac1, Gr1, B220, Ter-119, or CD4 and analyzed by FACS. (D) Wright-stained bone marrow smears (bottom; bar, 25 μM) or hematoxylin and eosin–stained bone marrow sections (top; bar, 60 μM) from WT mice injected with LPS or PBS for 72 h.
Figure 2.
Figure 2.
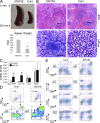
Expression of miR-155 in HSCs causes a myeloproliferative disorder in the bone marrow. (A) Depiction of the retroviral construct used to enable both miR-155 and GFP expression in HSCs. (B) Bone marrow cells of mice reconstituted with MG155- or control vector–transduced HSCs were analyzed for their expression of GFP by FACS, where the percentage of GFP+ cells is indicated. Black line, C57BL6 control; gray line, MG155 or control vector. Cells from the same compartments were analyzed for miR-155 expression using quantitative PCR (mean ± SD). (C) Tibias were removed from mice reconstituted with MG155 or control vector HSCs for 2 mo, or untreated C57BL6 (B6) mice, and photographs were taken. (D) Hematoxylin and eosin–stained bone marrow sections from miR-155–expressing or control mice (top; bar, 60 μM). Wright-stained bone marrow smears from mice reconstituted with MG155 or control vector HSCs (bottom; bar, 25 μm). (E) Examples of dysplastic myeloid cells observed in miR-155–expressing bone marrow are enlarged. (F) Number of specified cell types found in the bone marrow (one femur plus one tibia) of mice reconstituted with MG155 or control vector HSCs (mean ± SD). (G) GFP-gated bone marrow cells from mice reconstituted with MG155 or control vector HSCs were analyzed for FSC and SSC counts and expression of Mac1 and Gr1. (H) Bone marrow cells from mice reconstituted with MG155 or control vector HSCs were analyzed for expression of Mac1, Ter-119, or B220 on both GFP+ and GFP cells by FACS. Data represent at least six independent animals in each group, and p-values (*) of <0.05 were considered significant after a Student's two-tailed t test.
Figure 3.
Figure 3.
Expression of miR-155 in HSCs triggers extramedullary hematopoiesis in the spleen. (A) Spleens were removed from mice reconstituted with MG155 or control vector HSCs for 2 mo, and photographs were taken (top). Spleen weight was also determined in the two groups (bottom; mean ± SD). (B) Hematoxylin and eosin–stained sections (top; bar, 200 μm) or Wright-stained touch preps (bottom; bar, 25 μm) from mice reconstituted with MG155 or control vector HSCs. (C) Number of specified cell types found in the spleens of mice reconstituted with MG155 or control vector HSCs (mean ± SD). (D) GFP-gated spleen cells from mice reconstituted with MG155 or control vector HSCs were analyzed for FSC and SSC counts and expression of Mac1 and Gr1. (E) Splenocytes from mice reconstituted with MG155 or control vector HSCs were analyzed for expression of Mac1, Ter-119, CD4, or B220 on GFP+ and GFP cells by FACS. Data represent at least six independent animals in each group, and p-values (*) of <0.05 were considered significant using a Student's two-tailed t test.
Figure 4.
Figure 4.
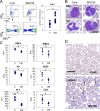
Expression of miR-155 in HSCs perturbs peripheral blood cell populations. (A) Peripheral blood was collected from mice reconstituted with MG155 or control vector HSCs for 2 mo and analyzed by FACS to determine FSC and SSC counts and expression of Mac1. The total number of Mac1 cells was also determined. (B) Photomicrographs of a normal Wright-stained monocyte (Mo) and neutrophil (Ne) from the blood of mice reconstituted with control vector HSCs, and two examples of the Wright-stained irregular myeloid cells found in MG155 HSC-reconstituted animals (bar, 5 μm). (C) RBC, hemoglobin (Hb), platelet, white blood cell, B220 B cell, and CD4 T cell levels in the blood of mice reconstituted with MG155 or control vector HSCs. (D) Microscopic photographs of Wright-stained peripheral blood RBCs from mice reconstituted with MG155 or control vector HSCs (bar, 10 μm). Data represent at least nine independent animals in each group, and p-values (*) of <0.05 were considered significant after a Student's two-tailed t test.
Figure 5.
Figure 5.
Overexpression of miR-155 in a subset of human AML patients. (A) RNA was collected from the bone marrow of 6 normal patients and 24 patients diagnosed with AML. MiR-155 (left) and 5S RNA (right) expression levels were assessed using quantitative PCR. (B) MiR-155 and 5S RNA expression data were compared between normal subjects and AML patients of the FAB subtypes M4 and M5. Group differences were considered statistically significant when the p-value (*) was <0.05.
Figure 6.
Figure 6.
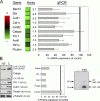
Repression of specific target genes involved in myeloid hyperplasia and/or hematopoiesis by miR-155. (A) Messenger RNA from Raw 264.7 cells infected with MSCVpuro-155 or empty vector control was subjected to a microarray analysis, and results indicate expression changes mediated by miR-155. The intensities of red and green correlate with increased or decreased mRNA levels, respectively, and numerical repression values for each mRNA are listed. RNA from the same cell types were converted to cDNA and used to assay expression of these genes by quantitative PCR (mean ± SD). All values have been normalized to L32 mRNA levels, are displayed as percent expression of control, and are the average of three independent experiments. (B) Western blotting was performed to assay Cebpb, PU.1, Cutl1, Picalm, or αTubulin using extract from Raw 264.7 cells stably expressing miR-155 or empty vector, and data are representative of at least three independent experiments (left and middle). Expression of miR-155 in Raw 264.7 cells infected with MSCVpuro-155 or empty vector control was assayed by Northern blotting to ensure proper expression of mature miR-155 (right).
Figure 7.
Figure 7.
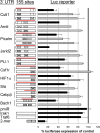
MiR-155 repression of specific target genes occurs through direct 3′ UTR interactions. (A) The 3′ UTR regions from identified miR-155 target mRNAs containing miR-155 binding site(s) with conserved 7- or 8-mer seeds (gray boxes), nonconserved 7-mer seed (Arntl, white box), or conserved 6-mer seed (Cutl1, white box) were cloned downstream from luciferase (pmiReport vector). Mutations to these specific seed regions are marked with an X. The region of the 3′ UTR cloned is designated with a red line, and the cartoon schematics of the UTRs are not drawn to scale. These constructs were used for reporter assays in 293T cells by cotransfection with a control β-galactosidase expression plasmid and a miR-155 expression vector (FUW-155) or empty vector control (FUW). A positive control vector contained tandem miR-155 binding sites, whereas negative controls contained no 3′ UTR or the 3′ UTR from Irak1 or Traf6, which lack miR-155 sites. Data using WT 3′ UTRs are in black, and mutant UTRs are in gray. All luciferase values have been normalized to β-galactosidase and are represented as percent luciferase expression of control (mean ± SD). All data are a triplicate set representing at least three independent experiments.

Similar articles

Cited by

References

    1. Rosenbauer, F., and D.G. Tenen. 2007. Transcription factors in myeloid development: balancing differentiation with transformation. Nat. Rev. Immunol. 7:105–117. - PubMed
    1. Ambros, V. 2004. The functions of animal microRNAs. Nature. 431:350–355. - PubMed
    1. Bartel, D.P., and C.Z. Chen. 2004. Micromanagers of gene expression: the potentially widespread influence of metazoan microRNAs. Nat. Rev. Genet. 5:396–400. - PubMed
    1. He, L., and G.J. Hannon. 2004. MicroRNAs: small RNAs with a big role in gene regulation. Nat. Rev. Genet. 5:522–531. - PubMed
    1. Georgantas, R.W. III, R. Hildreth, S. Morisot, J. Alder, C.G. Liu, S. Heimfeld, G.A. Calin, C.M. Croce, and C.I. Civin. 2007. CD34+ hematopoietic stem-progenitor cell microRNA expression and function: a circuit diagram of differentiation control. Proc. Natl. Acad. Sci. USA. 104:2750–2755. - PMC - PubMed

Publication types

MeSH terms

Associated data