. 2007:2007:26839.
doi: 10.1155/2007/26839.

Comprehensive analysis of PPARalpha-dependent regulation of hepatic lipid metabolism by expression profiling

Affiliations

Comprehensive analysis of PPARalpha-dependent regulation of hepatic lipid metabolism by expression profiling

Maryam Rakhshandehroo et al. PPAR Res. 2007.

Abstract

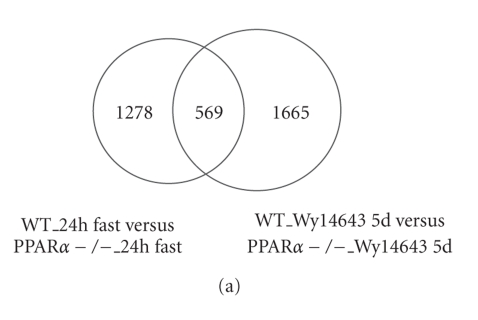
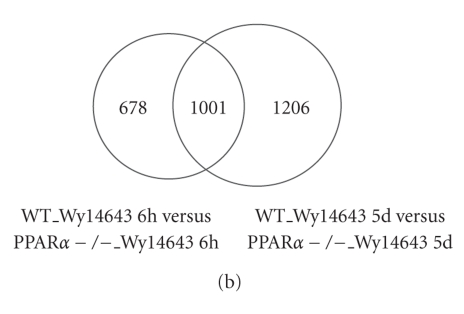
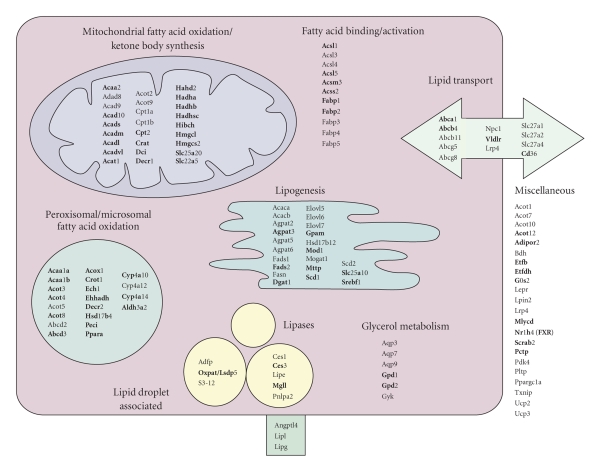
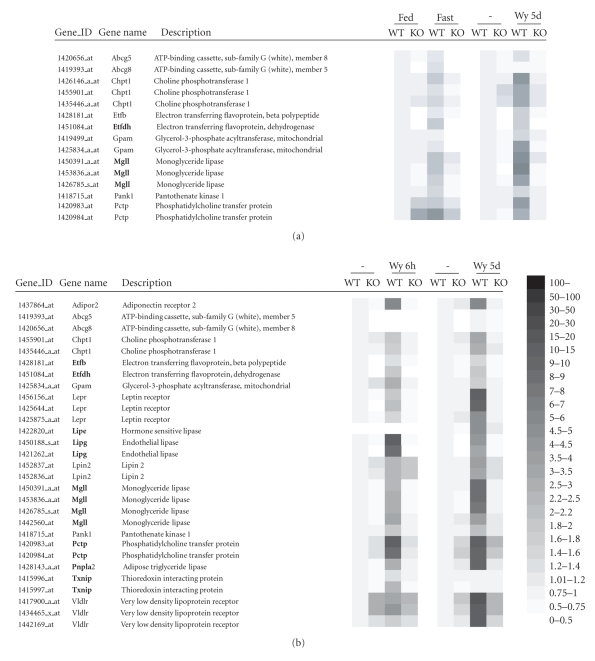
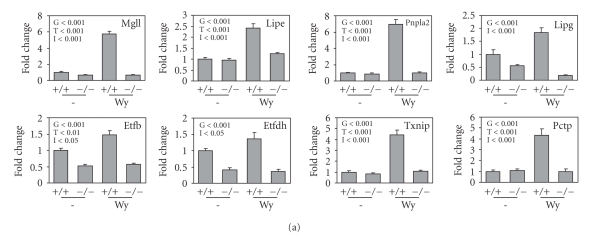
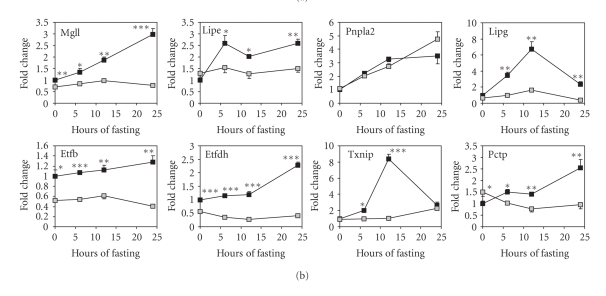
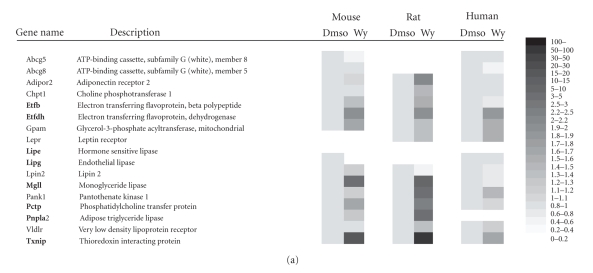
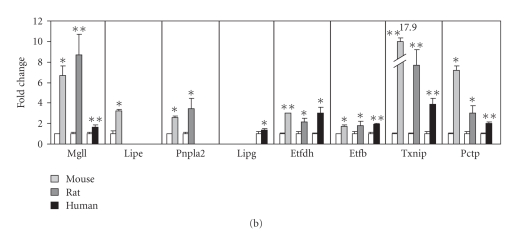
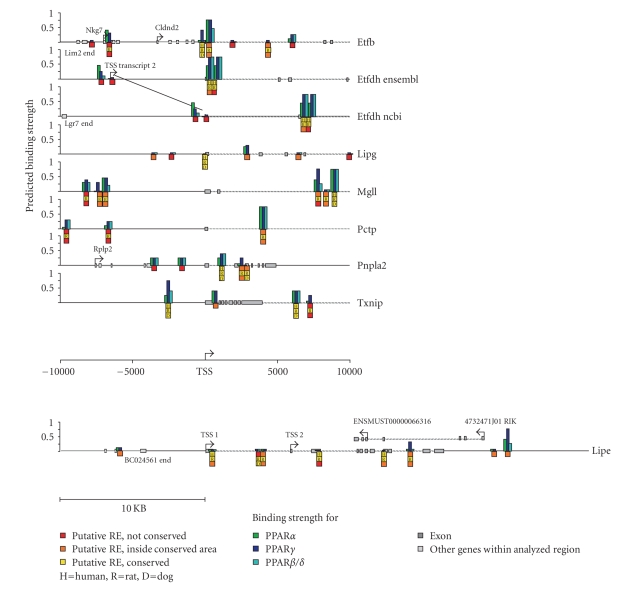
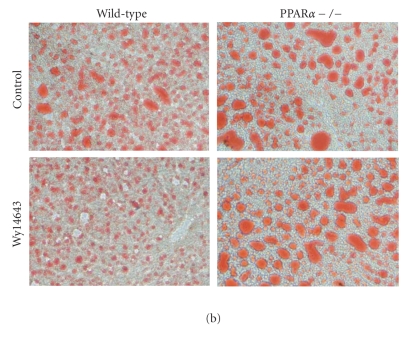
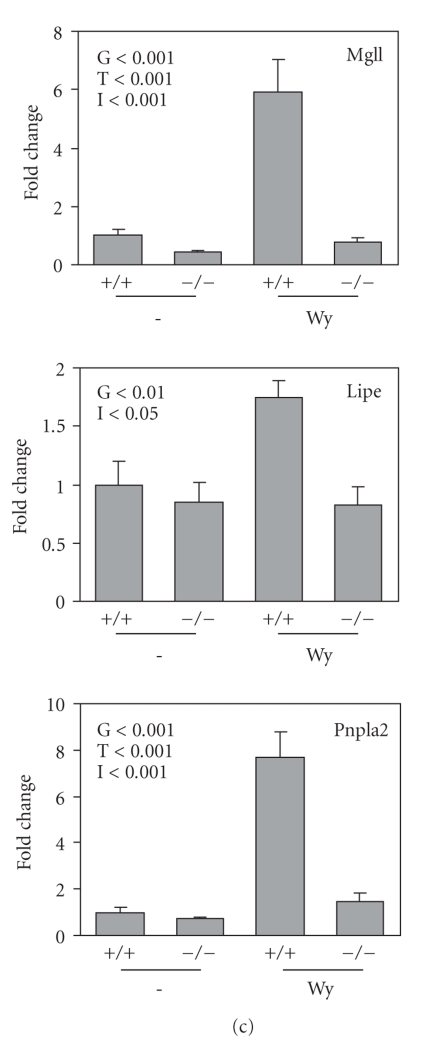
PPARalpha is a ligand-activated transcription factor involved in the regulation of nutrient metabolism and inflammation. Although much is already known about the function of PPARalpha in hepatic lipid metabolism, many PPARalpha-dependent pathways and genes have yet to be discovered. In order to obtain an overview of PPARalpha-regulated genes relevant to lipid metabolism, and to probe for novel candidate PPARalpha target genes, livers from several animal studies in which PPARalpha was activated and/or disabled were analyzed by Affymetrix GeneChips. Numerous novel PPARalpha-regulated genes relevant to lipid metabolism were identified. Out of this set of genes, eight genes were singled out for study of PPARalpha-dependent regulation in mouse liver and in mouse, rat, and human primary hepatocytes, including thioredoxin interacting protein (Txnip), electron-transferring-flavoprotein beta polypeptide (Etfb), electron-transferring-flavoprotein dehydrogenase (Etfdh), phosphatidylcholine transfer protein (Pctp), endothelial lipase (EL, Lipg), adipose triglyceride lipase (Pnpla2), hormone-sensitive lipase (HSL, Lipe), and monoglyceride lipase (Mgll). Using an in silico screening approach, one or more PPAR response elements (PPREs) were identified in each of these genes. Regulation of Pnpla2, Lipe, and Mgll, which are involved in triglyceride hydrolysis, was studied under conditions of elevated hepatic lipids. In wild-type mice fed a high fat diet, the decrease in hepatic lipids following treatment with the PPARalpha agonist Wy14643 was paralleled by significant up-regulation of Pnpla2, Lipe, and Mgll, suggesting that induction of triglyceride hydrolysis may contribute to the anti-steatotic role of PPARalpha. Our study illustrates the power of transcriptional profiling to uncover novel PPARalpha-regulated genes and pathways in liver.


Figures

Figure 1
Figure 1
Microarray analysis of PPARα-dependent gene regulation in mouse liver. (a) Venn diagram showing the number of differentially expressed probesets between livers of 24-hour fasted wild-type and PPARα-null mice, and between wild-type and PPARα-null mice treated with the PPARα agonist Wy14643 for 5 days. Pooled RNA was hybridized to Affymetrix MOE430A arrays. A fold-change of >1.5 was used as cutoff. (b) Venn diagram showing the number of differentially expressed probesets between livers of wild-type and PPARα-null mice treated with the PPARα agonist Wy14643 for 6 hours, and between wild-type and PPARα-null mice treated with the PPARα agonist Wy14643 for 5 days. RNA from individual mice was hybridized to mouse 430 2.0 arrays. Probesets that satisfied the criteria of fold-change >1.5 and FDR <0.01 were considered to be significantly regulated.
Figure 1
Figure 1
Microarray analysis of PPARα-dependent gene regulation in mouse liver. (a) Venn diagram showing the number of differentially expressed probesets between livers of 24-hour fasted wild-type and PPARα-null mice, and between wild-type and PPARα-null mice treated with the PPARα agonist Wy14643 for 5 days. Pooled RNA was hybridized to Affymetrix MOE430A arrays. A fold-change of >1.5 was used as cutoff. (b) Venn diagram showing the number of differentially expressed probesets between livers of wild-type and PPARα-null mice treated with the PPARα agonist Wy14643 for 6 hours, and between wild-type and PPARα-null mice treated with the PPARα agonist Wy14643 for 5 days. RNA from individual mice was hybridized to mouse 430 2.0 arrays. Probesets that satisfied the criteria of fold-change >1.5 and FDR <0.01 were considered to be significantly regulated.
Figure 2
Figure 2
Overview of PPARα-regulated genes involved in hepatic lipid metabolism. Genes in bold are PPARα-dependently regulated during fasting and by Wy14643, representing a conservative list of PPARα targets. Genes in normal font are PPARα dependently regulated in any of the four studies included. Functional classification is based on a self-made functional annotation system of genes involved in lipid metabolism (http://nutrigene.4t.com/microarray/ppar2007).
Figure 3
Figure 3
PPARα-dependent regulation in mouse liver of selected genes involved in lipid metabolism as shown by heat map. The (GCRMA normalized) expression data were derived from 4 separate microarray studies. Expression levels in wild-type mice without treatment were set at 1. (a) Expression data derived from studies 1 and 2. (b) Expression data derived from studies 3 and 4. Genes in bold were selected for expression analysis by Q-PCR and in silico screening for putative PPREs.
Figure 4
Figure 4
PPARα governs expression of selected genes in mouse liver. (a) Regulation of expression of selected genes by Wy14643-feeding (5 days) in liver of wild-type (+/+) and PPARα-null mice (−/−), as determined by Q-PCR. Error bars represent SEM. Differences were evaluated statistically using two-way ANOVA. Significance (p-value) of effect of genotype (G), treatment (T) and interaction (I) between genotype and treatment is indicated in each figure. (b) Regulation of expression of selected genes by fasting in liver of wild-type (▪) and PPARα-null mice (□), as determined by Q-PCR. Error bars represent SEM. Differences in expression between wild-type and PPARα-null mice at each time point were evaluated by Student t test. *P<.05; **P<.01; ***P<.001.
Figure 4
Figure 4
PPARα governs expression of selected genes in mouse liver. (a) Regulation of expression of selected genes by Wy14643-feeding (5 days) in liver of wild-type (+/+) and PPARα-null mice (−/−), as determined by Q-PCR. Error bars represent SEM. Differences were evaluated statistically using two-way ANOVA. Significance (p-value) of effect of genotype (G), treatment (T) and interaction (I) between genotype and treatment is indicated in each figure. (b) Regulation of expression of selected genes by fasting in liver of wild-type (▪) and PPARα-null mice (□), as determined by Q-PCR. Error bars represent SEM. Differences in expression between wild-type and PPARα-null mice at each time point were evaluated by Student t test. *P<.05; **P<.01; ***P<.001.
Figure 5
Figure 5
Regulation of selected genes involved in lipid metabolism in primary hepatocytes by Wy14643. (a) Microarray-based heat map showing relative expression levels of genes calculated using a multichip modified gamma model for oligonucleotide signal (multi-mgMOS) and a remapped chip description file. Expression levels in the absence of ligand were set at 1. (b) Relative induction of expression of selected genes in primary hepatocytes by Wy14643, as determined by Q-PCR. The primary hepatocytes used for Q-PCR and microarray analysis were from independent experiments. Genes were not included when expression was extremely low (Ct > 30). Error bars represent SD. The effect of Wy14643 on gene expression was evaluated by Student t test. *P<.05; **P<.01.
Figure 5
Figure 5
Regulation of selected genes involved in lipid metabolism in primary hepatocytes by Wy14643. (a) Microarray-based heat map showing relative expression levels of genes calculated using a multichip modified gamma model for oligonucleotide signal (multi-mgMOS) and a remapped chip description file. Expression levels in the absence of ligand were set at 1. (b) Relative induction of expression of selected genes in primary hepatocytes by Wy14643, as determined by Q-PCR. The primary hepatocytes used for Q-PCR and microarray analysis were from independent experiments. Genes were not included when expression was extremely low (Ct > 30). Error bars represent SD. The effect of Wy14643 on gene expression was evaluated by Student t test. *P<.05; **P<.01.
Figure 6
Figure 6
In silico screening for putative PPREs for the selected 8 genes, 10 kbp up- and downstream of the transcriptional start site were examined for the presence of putative PPREs. For each putative PPRE identified, the predicted PPAR subtype specific binding strength was determined, as reflected by the height of the bar. The sequence conservation of the PPRE among various species is indicated.
Figure 7
Figure 7
Induction of the triglyceride hydrolysis pathway by Wy14643 is paralleled by a decrease in hepatic lipid stores. Hematoxilin and eosin staining (a) and oil red O staining (b) of representative liver sections of wild-type and PPARα-null mice treated or not with Wy14643 for 7 days (magnification 200X). All mice were given an HFD for 20 weeks prior to Wy14643 treatment. (c) Hepatic expression of Mgll, Lipe, and Pnpla2 in the 4 experimental groups as determined by Q-PCR. Error bars represent SEM. Differences were evaluated statistically using two-way ANOVA. Significance (p-value) of effect of genotype (G), treatment (T), and interaction (I) between genotype and treatment is indicated in each figure.
Figure 7
Figure 7
Induction of the triglyceride hydrolysis pathway by Wy14643 is paralleled by a decrease in hepatic lipid stores. Hematoxilin and eosin staining (a) and oil red O staining (b) of representative liver sections of wild-type and PPARα-null mice treated or not with Wy14643 for 7 days (magnification 200X). All mice were given an HFD for 20 weeks prior to Wy14643 treatment. (c) Hepatic expression of Mgll, Lipe, and Pnpla2 in the 4 experimental groups as determined by Q-PCR. Error bars represent SEM. Differences were evaluated statistically using two-way ANOVA. Significance (p-value) of effect of genotype (G), treatment (T), and interaction (I) between genotype and treatment is indicated in each figure.

Similar articles

Cited by

References

    1. Kersten S, Desvergne B, Wahli W. Roles of PPARs in health and disease. Nature. 2000;405(6785):421–424. - PubMed
    1. Evans RM, Barish GD, Wang Y-X. PPARs and the complex journey to obesity. Nature Medicine. 2004;10(4):355–361. - PubMed
    1. Desvergne B, Wahli W. Peroxisome proliferator-activated receptors: nuclear control of metabolism. Endocrine Reviews. 1999;20(5):649–688. - PubMed
    1. Bocher V, Pineda-Torra I, Fruchart J-C, Staels B. PPARs: transcription factors controlling lipid and lipoprotein metabolism. Annals of the New York Academy of Sciences. 2002;967:7–18. - PubMed
    1. Smith SA. Peroxisomal proliferater-activated receptors and the regulation of lipid oxidation and adipogenesis. Biochemical Society Transactions. 1997;25(4):1242–1248. - PubMed