The AKT-mTOR axis regulates de novo differentiation of CD4+Foxp3+ cells
- PMID: 18283119
- PMCID: PMC2275380
- DOI: 10.1084/jem.20071477
The AKT-mTOR axis regulates de novo differentiation of CD4+Foxp3+ cells
Abstract
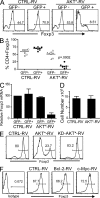
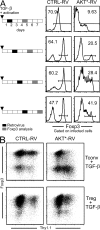
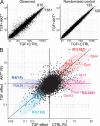
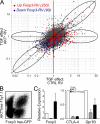
CD4(+)Foxp3(+) regulatory T (T reg) cells play an essential role in maintaining immunological tolerance via their suppressive function on conventional CD4(+) T (Tconv) cells. Repertoire studies suggest that distinct T cell receptor signaling pathways lead to T reg differentiation, but the signals that regulate T reg specification are largely unknown. We identify AKT as a strong repressor of entry into the T reg phenotype in vitro and in vivo. A constitutively active allele of AKT substantially diminished TGF-beta-induced Foxp3 expression in a kinase-dependent manner and via a rapamycin-sensitive pathway, implicating the AKT-mammalian target of rapamycin axis. The observed impairment in Foxp3 induction was part of a broad dampening of the typical T reg transcriptional signature. Expression of active AKT at a stage before Foxp3 turn on during normal T reg differentiation in the thymus selectively impaired differentiation of CD4(+)Foxp3(+) cells without any alteration in the positive selection of Tconv. Activated AKT, in contrast, did not affect established Foxp3 expression in T reg cells. These results place AKT at a nexus of signaling pathways whose proper activation has a strong and broad impact on the onset of T reg specification.
Figures


Similar articles
-
mTORC1 couples immune signals and metabolic programming to establish T(reg)-cell function.Nature. 2013 Jul 25;499(7459):485-90. doi: 10.1038/nature12297. Epub 2013 Jun 30. Nature. 2013. PMID: 23812589 Free PMC article.
-
The receptor S1P1 overrides regulatory T cell-mediated immune suppression through Akt-mTOR.Nat Immunol. 2009 Jul;10(7):769-77. doi: 10.1038/ni.1743. Epub 2009 May 31. Nat Immunol. 2009. PMID: 19483717 Free PMC article.
-
CD4+ FoxP3+ regulatory T cells confer infectious tolerance in a TGF-beta-dependent manner.J Exp Med. 2008 Sep 1;205(9):1975-81. doi: 10.1084/jem.20080308. Epub 2008 Aug 18. J Exp Med. 2008. PMID: 18710931 Free PMC article.
-
Foxp3+ regulatory T cells: differentiation, specification, subphenotypes.Nat Immunol. 2009 Jul;10(7):689-95. doi: 10.1038/ni.1760. Nat Immunol. 2009. PMID: 19536194 Review.
-
Human regulatory T cells: a unique, stable thymic subset or a reversible peripheral state of differentiation?Immunol Lett. 2007 Nov 30;114(1):9-15. doi: 10.1016/j.imlet.2007.08.012. Epub 2007 Sep 29. Immunol Lett. 2007. PMID: 17945352 Free PMC article. Review.
Cited by
-
Metabolic dialogues: regulators of chimeric antigen receptor T cell function in the tumor microenvironment.Mol Oncol. 2024 Jul;18(7):1695-1718. doi: 10.1002/1878-0261.13691. Epub 2024 Jun 22. Mol Oncol. 2024. PMID: 38922759 Free PMC article. Review.
-
Nature and nurture in Foxp3(+) regulatory T cell development, stability, and function.Hum Immunol. 2012 Mar;73(3):232-9. doi: 10.1016/j.humimm.2011.12.012. Epub 2011 Dec 27. Hum Immunol. 2012. PMID: 22240298 Free PMC article. Review.
-
Control of PI(3) kinase in Treg cells maintains homeostasis and lineage stability.Nat Immunol. 2015 Feb;16(2):188-96. doi: 10.1038/ni.3077. Epub 2015 Jan 5. Nat Immunol. 2015. PMID: 25559257 Free PMC article.
-
Function and Role of Regulatory T Cells in Rheumatoid Arthritis.Front Immunol. 2021 Apr 1;12:626193. doi: 10.3389/fimmu.2021.626193. eCollection 2021. Front Immunol. 2021. PMID: 33868244 Free PMC article. Review.
-
Immune dysregulation in patients with PTEN hamartoma tumor syndrome: Analysis of FOXP3 regulatory T cells.J Allergy Clin Immunol. 2017 Feb;139(2):607-620.e15. doi: 10.1016/j.jaci.2016.03.059. Epub 2016 Jun 18. J Allergy Clin Immunol. 2017. PMID: 27477328 Free PMC article.
References
-
- Schwartz, R.H. 2005. Natural regulatory T cells and self-tolerance. Nat. Immunol. 6:327–330. - PubMed
-
- Sakaguchi, S. 2004. Naturally arising CD4+ regulatory T cells for immunologic self-tolerance and negative control of immune responses. Annu. Rev. Immunol. 22:531–562. - PubMed
-
- Fontenot, J.D., and A.Y. Rudensky. 2005. A well adapted regulatory contrivance: regulatory T cell development and the forkhead family transcription factor Foxp3. Nat. Immunol. 6:331–337. - PubMed
-
- Sakaguchi, S., M. Ono, R. Setoguchi, H. Yagi, S. Hori, Z. Fehervari, J. Shimizu, T. Takahashi, and T. Nomura. 2006. Foxp3+ CD25+ CD4+ natural regulatory T cells in dominant self-tolerance and autoimmune disease. Immunol. Rev. 212:8–27. - PubMed
-
- Hori, S., T. Nomura, and S. Sakaguchi. 2003. Control of regulatory T cell development by the transcription factor Foxp3. Science. 299:1057–1061. - PubMed
Publication types
MeSH terms
Substances
Associated data
- Actions
Grants and funding
LinkOut - more resources
Full Text Sources
Other Literature Sources
Molecular Biology Databases
Research Materials
Miscellaneous

