. 2008 Feb;4(2):e24.
doi: 10.1371/journal.pcbi.0040024.

How force might activate talin's vinculin binding sites: SMD reveals a structural mechanism

Affiliations

How force might activate talin's vinculin binding sites: SMD reveals a structural mechanism

Vesa P Hytönen et al. PLoS Comput Biol. 2008 Feb.

Abstract

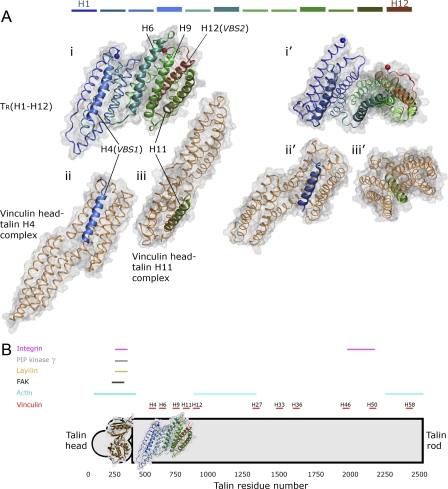
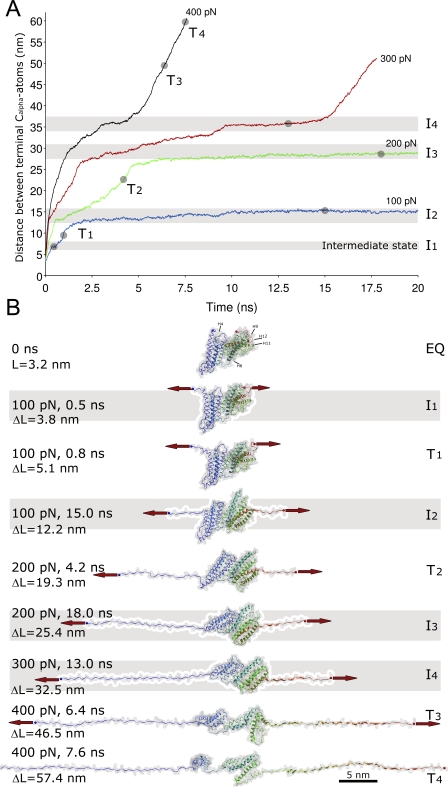
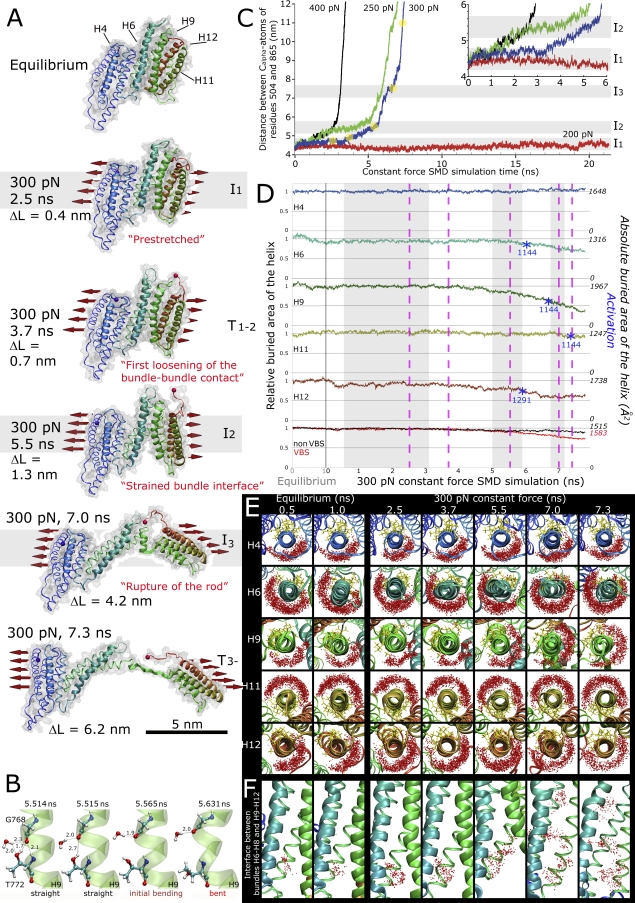
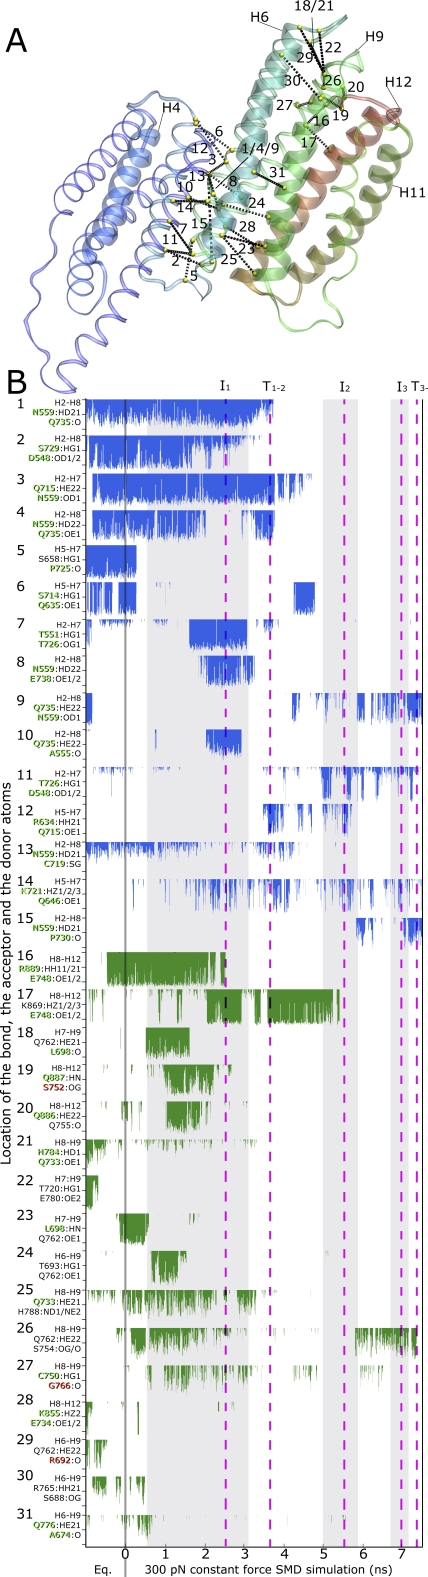
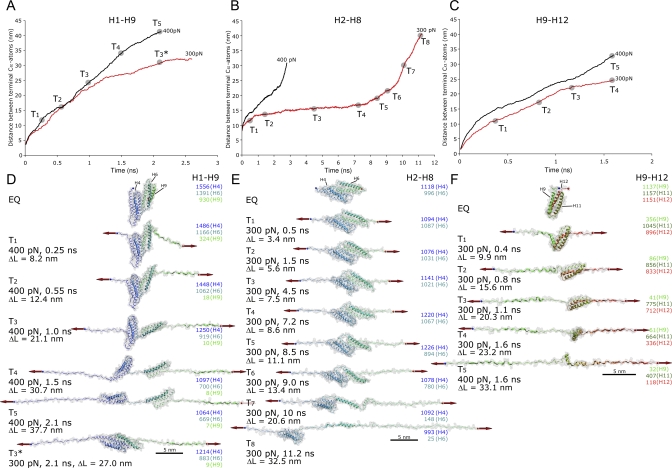
Upon cell adhesion, talin physically couples the cytoskeleton via integrins to the extracellular matrix, and subsequent vinculin recruitment is enhanced by locally applied tensile force. Since the vinculin binding (VB) sites are buried in the talin rod under equilibrium conditions, the structural mechanism of how vinculin binding to talin is force-activated remains unknown. Taken together with experimental data, a biphasic vinculin binding model, as derived from steered molecular dynamics, provides high resolution structural insights how tensile mechanical force applied to the talin rod fragment (residues 486-889 constituting helices H1-H12) might activate the VB sites. Fragmentation of the rod into three helix subbundles is prerequisite to the sequential exposure of VB helices to water. Finally, unfolding of a VB helix into a completely stretched polypeptide might inhibit further binding of vinculin. The first events in fracturing the H1-H12 rods of talin1 and talin2 in subbundles are similar. The proposed force-activated alpha-helix swapping mechanism by which vinculin binding sites in talin rods are exposed works distinctly different from that of other force-activated bonds, including catch bonds.


Conflict of interest statement

Competing interests. The authors have declared that no competing interests exist.

Figures

Figure 1
Figure 1. Structures of the α-Helix Bundle of Talin and of Its Vinculin Binding (VB) Helices in Complex with the Vinculin Head
(A) The talin rod fragment H1–H12, which contains five VB helices. The coloring is according to residue numbers (blue, N-terminus; red, C-terminus; colors of helices are shown at the top of the figure). The VB helices H4, H6, H9, H11, and H12 are shown in bold cartoon models, and the rest of the structure is presented by narrow ribbons. The molecular surface is presented in gray (1.4 Å scanning probe used). Terminal Cα-atoms are shown as spheres. (i) Talin fragment H1–H12 (PDB 1XWX). (ii) Vinculin head domain (VH) bound to talin helix H4 (VBS1) (PDB 1SYQ). VH (brown ribbon model) is aligned onto the talin rod fragment according to talin H4 (blue cartoon model). (iii) Vinculin head domain bound to talin H11 (VBS4; PDB 1ZVZ) aligned onto the talin rod according to H11. (i'–iii') are rotated views of (i–iii). (B) Overall schematic structure of talin indicating the location of the VB helices and other protein binding sites (integrin [3,12], layilin [5], PIP kinase γ [4], focal adhesion kinase [FAK] [5], actin [11], and vinculin [10]). The structurally unresolved talin head and rod domains are shown in gray overlaid with the known structures. Few trypsin-sensitive sites in the chicken TR have been determined, maybe indicating either some local looseness of the packing in the distant C-terminal rod region even under equilibrium conditions, or high flexibility in particular loops connecting helices (known cleaving sites in TR: residue 1653, between H36 and H37; 1804, in H41) [57].
Figure 2
Figure 2. Sequential Unfolding Trajectories and Associated Structures of the Talin Rod H1–H12 Extended under Constant Force Applied to Terminal Cα-atoms
(A) Extension-time plots for different constant force pulls, from 100–400 pN. Plateaus in the extension-time curves indicate the existence of multiple intermediate states (I1–I4). Simulations are carried out using the program NAMD. The SMD simulation was started after 1 ns of equilibration at a temperature of 310 K and 1 atm pressure. The explicit water model TIP3 was used. (B) Intermediate states (I1–4, gray bars) and transitional snapshots (T1–4) seen at indicated time points in the unfolding trajectories in (A).
Figure 3
Figure 3. Fragmentation of the Talin Rod into α-Helix Subbundles Leads to the Sequential Exposure of the Vinculin Binding Helices (VB Helices)
(A) Sequential structural snapshots of the mechanically strained talin H1–H12 rod. Three intermediate states are observed (I1, I2, I3). The pulling force of 300 pN was used in the depicted SMD simulation. The extension, i.e., the increase in the length of the H1–H12 as compared to the equilibrium state which measured 3.2 nm, is shown as (ΔL). Key transitional unfolding events detected in this simulation as H9–H12 separates from rest of the protein are shown in T1 and T2. (B) SMD simulations showed a transient bending of helix H9 at the onset of breaking the H1–H12 bundle into two pieces. The bending occurred at residue Thr772, which initially formed intrahelix bonds with Gly768:O with both the backbone nitrogen and the side chain oxygen. The hydrophilic side chain in Thr772 attracts water molecules that enter the helix bundle cleft when the talin rod is strained. The waters soon reach the helix backbone (5.514 ns), and then compete and attack the backbone hydrogen bond initially formed between Thr772 and Gly768, finally leading to the bending of the helix (5.631 ns). (C) Constant force extension-time plots when force is distributed over the length of the terminal helices H1 and H12 (200, 250, 300, or 400 pN). The distance between Cα-atoms of residues 504 and 865 is given. The extensions of the structural snapshots shown in (B) are indicated in the extension time-plots in (C). (D) Change in the buried surface area of the VB helices during equilibration and when extended under 300 pN force calculated for the blue 300 pN trace shown in (C). The buried areas are shown normalized to the average buried area obtained during equilibration. The lowest graph shows the average buried area of the VB helices (red) and of other helices (nonVB, black). The dotted pink lines give the times at which the non-equilibrium structural snapshots in (B) were taken. The respective points of “activation”, i.e., when the buried areas of helices H6, H9, H11, and H12 in talin equal the experimentally found buried areas of isolated talin helices in complex with the vinculin head, are given as blue asterisks. For H6 and H9, the buried area determined for the H11-vinculin complex is used as a reference because there is no available structure of those helices in complex with vinculin. The buried area of H4 was higher than the buried area of the VH-H4 complex for the whole simulation period. The buried area of a helix was calculated by measuring the solvent accessible surface area (SASA) of the helix alone and subtracting the SASA of the helix embedded in the protein by using the program VMD. The scanning probe used was 1.4 Å. (E) Top views of the VB helices along the helix axes. Water molecules (red dots) located within 5 Å of the VB helix core (10–13 residues in the middle of the helix) from 20 frames over 100 ps time window are plotted together with the protein structure at different time points. The side chains of 10 most conserved residues in VBS helices [10], according to the consensus sequence LxxAAxxVAxALxxLLxxA are shown in a yellow stick representation. (F) Side views showing how water penetrates into the interface between the subbundles H1–H8 and H9–H12. The water molecules located in the vicinity of residues Leu716, Leu736, and Gly740 are plotted over a 100 ps time window (20 frames). The frames in the trajectory are aligned according to H8.
Figure 4
Figure 4. Side Chain Hydrogen Bonds Formed between the α-Helix Subbundles, H1–H5, H6–H8, H9–H12 in Talin1 as Identified in the Simulations
(A) Location of interbundle side chain hydrogen bonds is shown schematically in the equilibrated structure (Connection [black] of the Cα-atoms of the interacting residues [shown in yellow]). (B) Stability of interbundle hydrogen bonds: the bond length fluctuations are given at a scale of 2-4 Å, beyond which the bond is considered broken. In all the cases where amino acid side chains provide multiple donors or acceptors, the shortest of the bonds formed is shown. Multiple bonding partners are listed. The fluctuations of bonds connecting the helix bundles of H1–H5 to H6–H8 are shown in blue, while the ones connecting the H6–H8 to H9–H12 bundles are shown in green. The fully conserved residues among the talin1 and talin2 from human, mouse, and chicken (Figure S1) are written in green, and non-conserved residues in red.
Figure 5
Figure 5. Unfolding Trajectories of the Individual Talin Rod Subbundles
Once the talin rod is fragmented, the force will be transmitted via the terminal ends of the helices. Constant forces of 300 and 400 pN were thus applied to the termini of the fragments H1–H9 (A) and (D); H2–H8 (B) and (E); and H9–H12 (C) and (F) after 1 ns of equilibration. The distance between the terminal Cα-atoms of the fragments are plotted over time. The starting end-to-end distances of the terminal atoms of these helix bundles prior to stretching them were 3.6 nm (H1–H9), 7.9 nm (H2–H8), and 1.5 nm (H9–H12). (A,D) Force applied to the H1–H9 fragment first leads to the unfolding of H9 (T1) and is then followed by the unfolding of H1 (T2). Further pulling with 400 pN results in the separation of bundles H2–H5 and H6–H8 from each other (T2–T3). Then, the C-terminal bundle H6–H8 is the first to be unraveled (T5). The 300 pN simulation does not lead to a separation of bundles within 2.7 ns (T3*) and shows similarity with T3 of the H2–H8 fragment (B) and (E). (B,E) The 300 pN unfolding trajectory of the H2–H8 bundle not truncated along the “natural” interfaces shows sequential unfolding at the ends of the molecule (T1–T3). 400 pN force applied results in faster unfolding. The C-terminal part unfolds more easily indicating the lower stability of H6–H8 compared to H2–H5 (T7, T8). (C,F) The H9–H12 fragment shows only negligible resistance against applied force even if pulled at 300 pN force.
Figure 6
Figure 6. Cartoon Model Shows How Vinculin Binding to Talin Might Be Force-Activated
VB helices are presented as colored cartoons, and other helices in H1–H12 (PDB 1XWX) are shown in light gray cartoon models. The gray shaded areas represent the talin regions for which no high resolution structures are available. The vinculin cartoon is based on the X-ray structure of autoinhibited full length vinculin (PDB 1TR2). (A) No force applied: When talin is not stressed, vinculin has low affinity for talin. Talin forms a force-bearing linkage between the extracellular matrix (gray) bound integrins and actin filaments (shown in brown). It remains unclear whether talin is parallel or tilted with respect to the cell membrane, and whether it forms a dimer. (B) Prerequisite for force-activation: When mechanical force is applied to the integrin-actin linkage, talin is stretched. Force causes the breakage of the talin rod into helix sub-bundles, which constitutes the major energy barrier. The subbundles H1–H5, H6–H8, and H9–H12 differ in their mechanical stabilities leading to a hierarchal sequence in which they break apart. The forced unfolding pathway of the talin rod might be altered by interaction with other molecules, including PIP2 and vinculin [30], or the potential the dimerization of talin. (C) Activation of talin's VB helices: Continued talin extension causes sequential exposure of the VB helices to water and leads finally to a separation from their host bundles. While the buried surface area of the VB helices in unstrained talin is larger than if comlexed with vinculin, conformational strain gradually exposes their hydrophobic residues—once activated, they can form an energetically more favored complex with the unstrained vinculin head. In this schematic model, only one vinculin molecule is shown. Since there are multiple vinculin binding sites in talin, the number of exposed VB helices is dependent on the applied force and the force-exposure time of talin. (D) Vinculin binding to talin is enabled by α-helix swapping: a water-exposed VB helix can minimize its free energy by associating with the α-helix bundle of the vinculin head thereby burying its VBSs from water. Experiments indicate that the interaction of the vinculin head with a talin VB helix releases the VH–VT interaction [–26] and thus allows the VT (VT domain shown in red) to bind to actin. The linker connecting VT to the rest of the vinculin is constructed manually. (E) Prolonged exposure to tensile mechanical force may cause complete unraveling of individual VB helices, and we propose that this leads to a deactivation of vinculin binding. However, binding of vinculin to a VH helix might stabilize the VB helix from force-induced unfolding.

Similar articles

Cited by

References

    1. Jiang G, Giannone G, Critchley DR, Fukumoto E, Sheetz MP. Two-piconewton slip bond between fibronectin and the cytoskeleton depends on talin. Nature. 2003;424:334–337. - PubMed
    1. Calderwood DA, Ginsberg MH. Talin forges the links between integrins and actin. Nat Cell Biol. 2003;5:694–697. - PubMed
    1. Calderwood DA, Zent R, Grant R, Rees DJ, Hynes RO, et al. The talin head domain binds to integrin beta subunit cytoplasmic tails and regulates integrin activation. J Biol Chem. 1999;274:28071–28074. - PubMed
    1. Barsukov IL, Prescot A, Bate N, Patel B, Floyd DN, et al. Phosphatidylinositol phosphate kinase type 1gamma and beta1-integrin cytoplasmic domain bind to the same region in the talin FERM domain. J Biol Chem. 2003;278:31202–31209. - PubMed
    1. Borowsky ML, Hynes RO. Layilin, a novel talin-binding transmembrane protein homologous with C-type lectins, is localized in membrane ruffles. J Cell Biol. 1998;143:429–442. - PMC - PubMed

Publication types