. 2008 Feb;6(2):e27.
doi: 10.1371/journal.pbio.0060027.

Transcription factors bind thousands of active and inactive regions in the Drosophila blastoderm

Affiliations

Transcription factors bind thousands of active and inactive regions in the Drosophila blastoderm

Xiao-yong Li et al. PLoS Biol. 2008 Feb.

Abstract

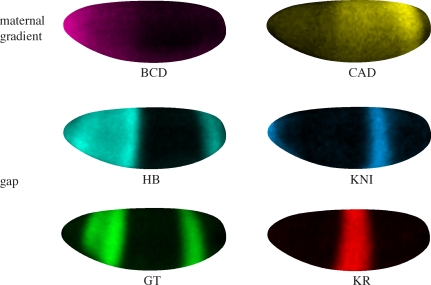
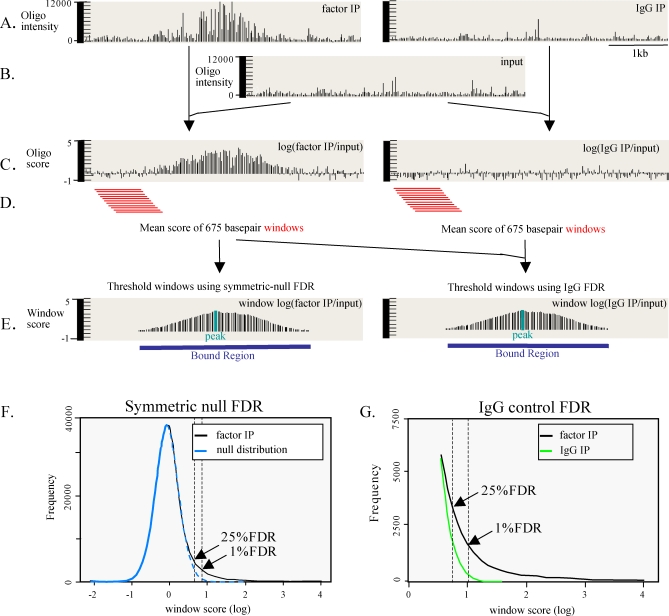
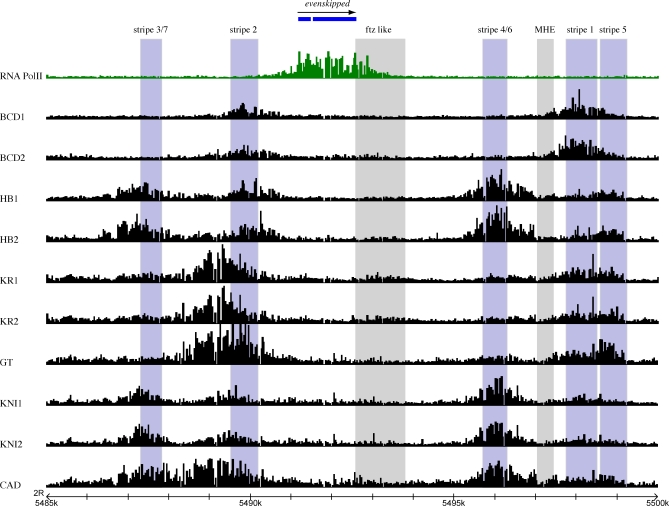
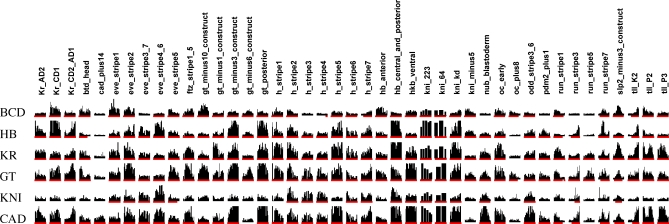
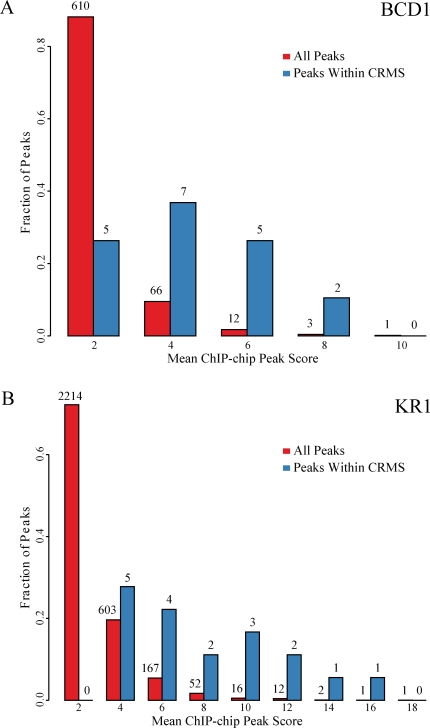
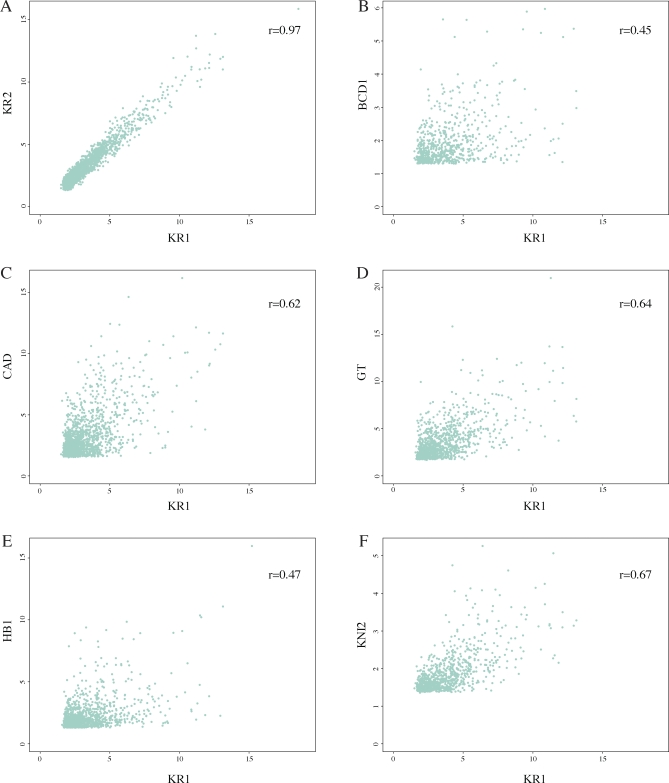
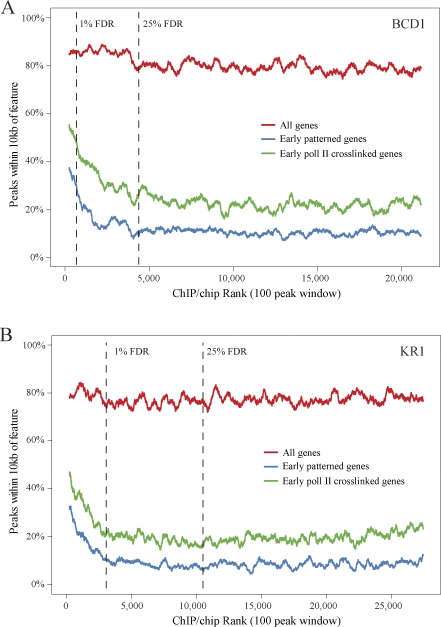
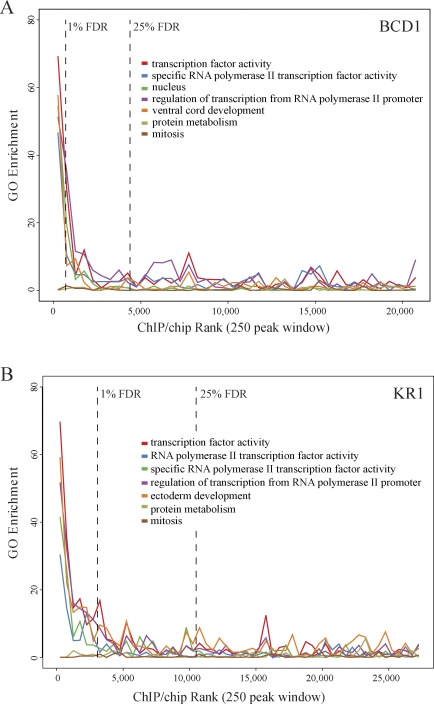
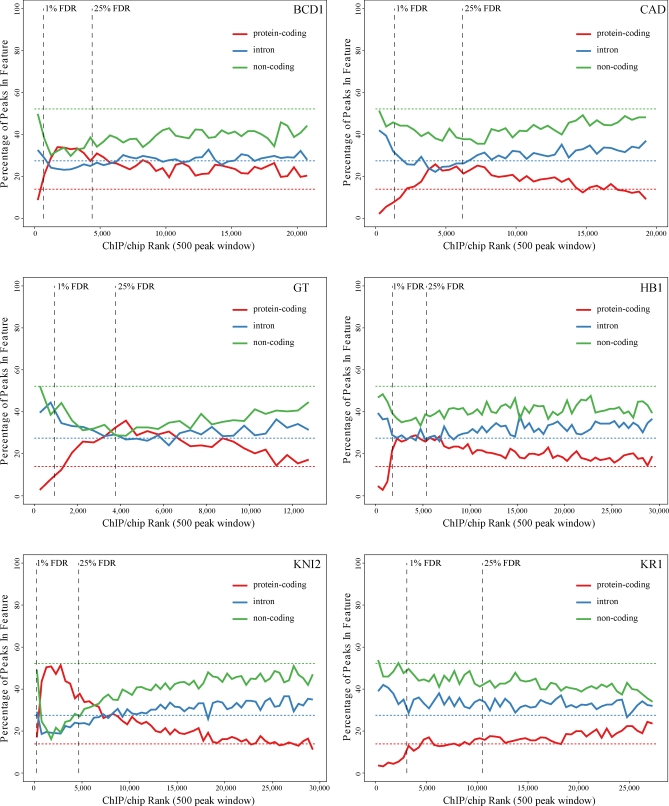
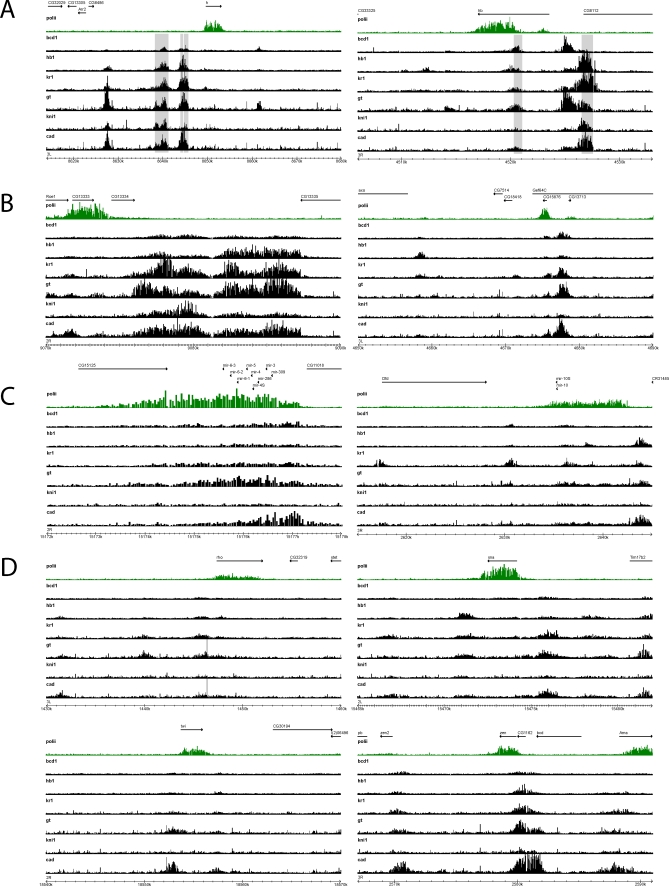
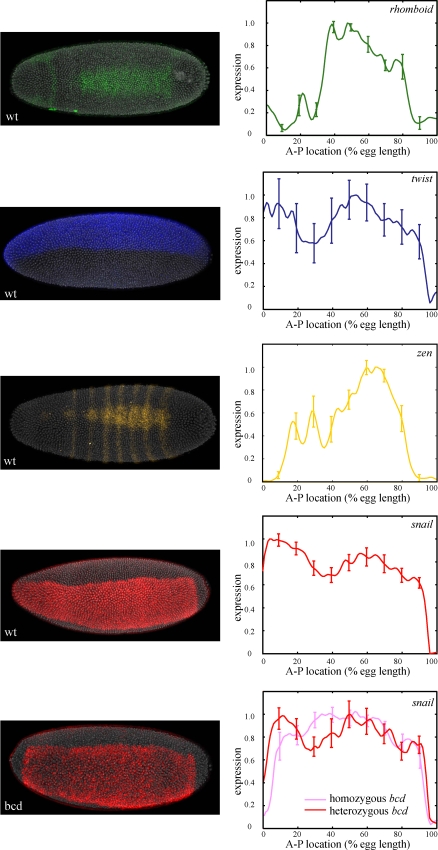
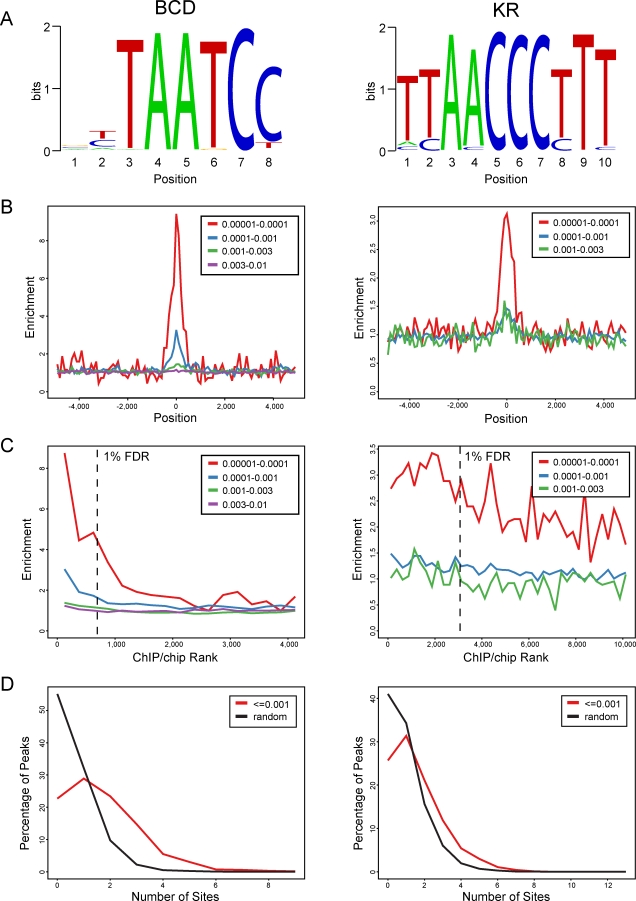
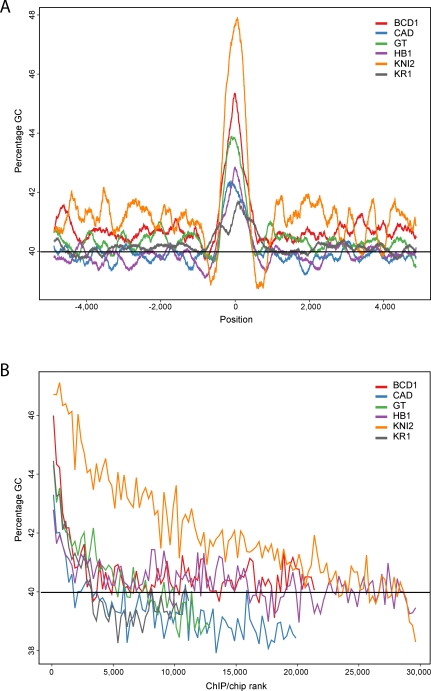
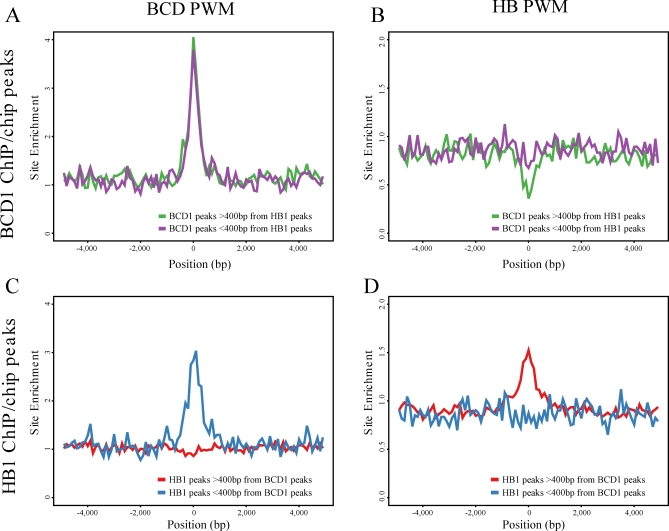
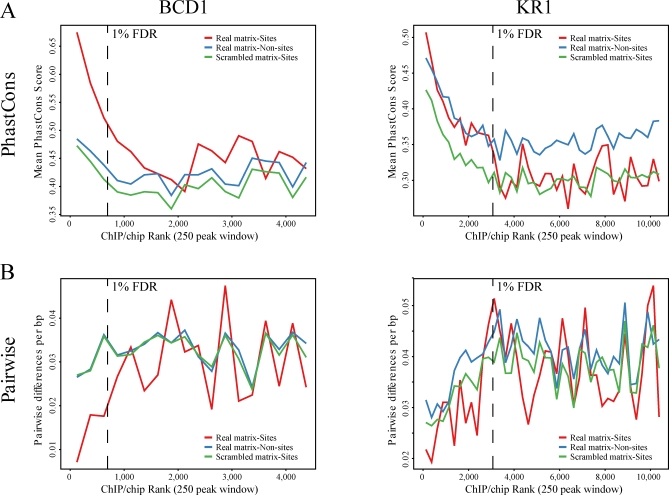
Identifying the genomic regions bound by sequence-specific regulatory factors is central both to deciphering the complex DNA cis-regulatory code that controls transcription in metazoans and to determining the range of genes that shape animal morphogenesis. We used whole-genome tiling arrays to map sequences bound in Drosophila melanogaster embryos by the six maternal and gap transcription factors that initiate anterior-posterior patterning. We find that these sequence-specific DNA binding proteins bind with quantitatively different specificities to highly overlapping sets of several thousand genomic regions in blastoderm embryos. Specific high- and moderate-affinity in vitro recognition sequences for each factor are enriched in bound regions. This enrichment, however, is not sufficient to explain the pattern of binding in vivo and varies in a context-dependent manner, demonstrating that higher-order rules must govern targeting of transcription factors. The more highly bound regions include all of the over 40 well-characterized enhancers known to respond to these factors as well as several hundred putative new cis-regulatory modules clustered near developmental regulators and other genes with patterned expression at this stage of embryogenesis. The new targets include most of the microRNAs (miRNAs) transcribed in the blastoderm, as well as all major zygotically transcribed dorsal-ventral patterning genes, whose expression we show to be quantitatively modulated by anterior-posterior factors. In addition to these highly bound regions, there are several thousand regions that are reproducibly bound at lower levels. However, these poorly bound regions are, collectively, far more distant from genes transcribed in the blastoderm than highly bound regions; are preferentially found in protein-coding sequences; and are less conserved than highly bound regions. Together these observations suggest that many of these poorly bound regions are not involved in early-embryonic transcriptional regulation, and a significant proportion may be nonfunctional. Surprisingly, for five of the six factors, their recognition sites are not unambiguously more constrained evolutionarily than the immediate flanking DNA, even in more highly bound and presumably functional regions, indicating that comparative DNA sequence analysis is limited in its ability to identify functional transcription factor targets.


Conflict of interest statement

Competing interests. The authors have declared that no competing interests exist.

Figures

Figure 1
Figure 1. Patterns of mRNA Expression of the Six Maternal and Gap Genes Controlling Trunk Segmentation along the Anterior–Posterior Axis
Expression (protein for BCD and mRNA for the other factors) is shown in orthographic projections using PointCloudXplore [100] to display data from the BDTNP's VirtualEmbryo [11] (BDTNP, unpublished data). The embryos are shown with anterior to the left, posterior right, dorsal at the top, and ventral at the bottom.
Figure 2
Figure 2. Overview of ChIP/chip Data Analysis Methods
(A–C) Mean hybridization intensities (A) for Factor IP replicates (left) and IgG control IP replicates (IgG) (right) are divided by the mean probe intensity in the input DNA samples (B) to produce oligonucleotide ratio values (C). (D–G) The logarithms of the ratios in (C) are averaged in windows (D) of 675 bp centered around each probe (after discarding the highest and lowest values, to produce a “trimmed mean”) to produce window scores (E). Bound regions (E) were identified by comparing window scores to expected score distributions computed from a symmetric null distribution (F) or from IgG controls (G). The symmetric null method assumes that the background window score distribution is symmetric about its mean, and estimates the distribution from values less than the observed mode ([F] light-blue line). This estimated null distribution was used to assign p-values to each window score, and these were corrected for multiple testing to control the FDR, using the method of ([95] and http://faculty.washington.edu/∼jstorey/qvalue/). The IgG control is similar except that the empirical distribution of window scores from the IgG immunoprecipitations ([G] light-green line) is used as the estimated null distribution.
Figure 3
Figure 3. In Vivo Binding to the even skipped Locus
Oligonucleotide ratio scores for all ChIP/chip experiments across the well-characterized even skipped locus. Data are shown for RNA PolII and all six factors. Note the agreement of the independently purified antibody for BCD, HB, KR, and KNI. The light-blue boxes mark the positions of experimentally characterized A-P enhancers regulating stripe 1 [21], stripe 2 [18], stripes 3 and 7 [101], stripes 4 and 6 [21], and stripe 5 [21]. For comparison, the grey boxes mark the positions of two enhancers that do not respond to these factors in the blastoderm, the ftz-like enhancer [21] and the muscle and heart enhancer (MHE) [102].
Figure 4
Figure 4. Known cis-Regulatory Modules Involved in Anterior–Posterior Patterning Are Highly Bound by Multiple Factors
Oligonucleotide ratio scores for BCD1, HB1, KR1, GT, KNI2, and CAD for all cis-regulatory modules known to, or strongly believed to, be targeted by one or more of these factors prior to this study [8,9,33,103]. Only oligos within the region tested to demonstrate enhancer activity are shown. Red lines mark 1% FDR regions.
Figure 5
Figure 5. Known cis-Regulatory Modules Tend to Be among the Regions More Highly Bound In Vivo
The 1% FDR bound regions for BCD1 (A) and KR1 (B) were each divided into cohorts based on primary peak window score (x-axis). The fraction of all bound regions in each cohort (red bars) and fraction of bound regions in each cohort in which the primary peak is contained within a CRM known to be regulated by the A-P factors (blue bars) are shown. The number of bound regions in each cohort is given above the bars.
Figure 6
Figure 6. Factors Bind with Quantitatively Different Specificities to Shared Target Regions
Correlation of primary peak score between overlapping (within 500 bp) primary peaks. (A) shows the correlation of KR1 1% FDR peaks versus KR2 25% FDR peaks; (B–F) show KR1 1% FDR against BCD1, CAD, GT, HB1, and KNI2 25% FDR primary peaks, respectively. The Pearson correlation coefficients (r) for each comparison are shown in the top right of each panel.
Figure 7
Figure 7. Highly Bound Regions Are Associated with Genes Transcribed and Patterned in the Blastoderm
Analyzed are the percentage of primary peaks that are within 10 kb of the 5' end of a gene. Genes are divided into three categories, all genes (from genome release 4.3, March 2006), genes with known patterned expression (hand annotated based on Berkeley Drosophila Genome Project [BDGP] in situ images [35]) and transcribed genes (defined by our RNA Polymerase II ChIP/chip binding, see Materials and Methods). Percentages are calculated in nonoverlapping windows of 100 peaks down the rank list to the 80% FDR threshold. The position of the 1% and 25% FDR cutoffs are indicated with vertical dotted lines. (A) shows the results for the BCD1 antisera and (B) the results for the KR1 antisera.
Figure 8
Figure 8. Genes That Control Development Are Highly Bound In Vivo
The five most enriched GO ([98]) terms in the 1% FDR bound regions for each factor were identified (enrichment measured by a hypergeometric test). The significance of the enrichment (−log(p-value)) of these five terms plus those for two negative controls (protein metabolism and mitosis) in nonoverlapping windows of 250 peaks are shown down to the rank list for BCD1 (A) and KR1 (B) as far as the 80% FDR cutoff. The 1% and 25% FDR cutoffs are indicated by vertical dotted lines.
Figure 9
Figure 9. For Some Factors, Poorly Bound Regions Are Preferentially Found in Protein Coding Sequences
Percentage of primary peaks in nonoverlapping windows of 500 peaks that are in protein coding (red), intronic (blue), and intergenic (green) sequence. Results are shown for windows down the rank lists to the 80% FDR cutoff. The percentages for each class of genomic feature are indicated as horizontal dotted lines in corresponding colors to the solid data lines. The 1% and 25% FDR cutoffs are indicated by vertical dotted lines. The panels show results for peak windows for BCD1, CAD, GT, HB1, KNI2, and KR1.
Figure 10
Figure 10. New Targets of Maternal and Gap Transcription Factors
ChIP/chip oligonucleotide ratio scores for selected new targets. (A) Bound regions found near well-characterized A-P target genes hb and h, but which do not overlap known CRMs (shown in grey). For example, the binding 22 kb upstream of h is likely to be a novel h CRM because the other genes in proximity are not transcribed in the early embryo. (B) Genes transcribed in the early embryo that have no known function but are bound at moderate to high levels by multiple gap factors. In the left panel, CG13333/CG13334 loci, and the right, CG15876/CG13713 loci are shown. (C) miRNA genes that are actively transcribed in early embryos such as the gene that produces mir3, 4, 5, 6–1, 6–2, 6–3, 286, and 309 (left) and the mir-10 gene (right). See Table S3 for more details on binding to miRNA genes. (D) Binding in the region of D-V genes rho, twi, zen, and sna.
Figure 11
Figure 11. The mRNA Expression Patterns of Dorsal–Ventral Regulatory Factors Are Controlled by Anterior–Posterior Factors
Data for wild-type embryos (top four rows) and embryos derived from bcd heterozygous and homozygous mothers (bottom row) are shown. Left panels show the mRNA expression patterns of representative embryos stained for rho, twi, zen, and sna. Dorsal views are shown for sna and twi and ventral views for zen and rho. Right panels show the mean mRNA expression for each gene along the A-P axis for a narrow strip of cells on either the dorsal or ventral midline. The error bars give the 95% confidence intervals for the means. The data for rho expression were derived from n = 22 wild-type (wt) embryos, twist from n = 14 wild-type embryos, zen from n = 10 wild-type embryos, and sna from n = 45 wild-type embryos, n = 24 embryos derived from bcd heterozygous mothers, and n = 24 embryos derived from bcd homozygous mothers.
Figure 12
Figure 12. Recognition Sequences Are Modestly Enriched in Bound Regions
(A) Sequence logo representing the BCD and KR PWMs derived from SELEX data (made with seqlogo [99]). (B) Fold enrichment of matches to the PWM from (A) in 100-bp nonoverlapping windows across the 1% FDR primary peaks, with the peaks at position zero on the x-axis. PWM matches shown are divided in subsets based on the p-value of their match to the matrix. (C) Fold enrichment of matches to the PWM from (A) in the 500 bp around (±250 bp) regions around primary peaks, in nonoverlapping windows of 250 peaks down the ChIP/chip rank list to the 25% FDR cutoff. The 1% FDR cutoff is indicated as a vertical dotted line. As in (B), matches are divided based on the significance of their match to the matrix. (D) shows the distribution of the number of sites in the 500-bp (±250 bp) regions around 1% FDR primary peaks and, for comparison, randomly selected noncoding genomic sequence. In this panel, a match to the matrix is defined as having a PATSER p-value of ≤0.001.
Figure 13
Figure 13. Bound Regions in Noncoding DNA Display a GC Bias
(A) Average base composition (as represented by percentage GC) in nonoverlapping windows of 100 bp across the 10-kb regions (±5 kb) around 1% FDR primary peaks. (B) Base composition of the 500 bp (±250 bp) around primary peaks down the ChIP/chip rank list to the 80% FDR cutoff in nonoverlapping windows of 250 peaks. For both panels, only noncoding sequence was used in the analysis. The mean percentage GC content in noncoding DNA is indicated by the horizontal black line.
Figure 14
Figure 14. In Vivo Binding Is Influenced by a Context Determined by Other Factors
(A) and (B) show the fold enrichment of BCD and HB PWMs in nonoverlapping windows of 100 bp across the 10-kb regions (±5 kb) around 1% FDR BCD1 peaks, divided into those less than and greater than 400 bp from HB 1% FDR peaks. (C) and (D) show the same analysis for 1% FDR HB1 peaks divided into those less than or greater than 400 bp from BCD1 1% FDR peaks. As (D) shows, HB recognition sequences are not enriched in regions bound by both HB and BCD, but are enriched in regions bound by HB and not by BCD.
Figure 15
Figure 15. Recognition Sequence Conservation as a Function of Peak Intensity
Conservation scores in predicted factor recognition sequences (p-value ≤ 0.001) (red lines), all remaining sequences (blue lines), and in sequences matching scrambled variants of the factors' recognition sequences (p-value ≤ 0.001) (green lines) in the 500-bp regions (±250 bp) around BCD1 and KR1 1% FDR peaks, in nonoverlapping windows of 250 peaks down the rank list to the 25% FDR cutoff. Panels in row (A) shows the mean PhastCons scores, and panels in row (B) the average pairwise differences per base pair between D. melanogaster and D. simulans. Gaps are ignored in the pairwise analysis. The 1% FDR cutoff is indicated by a vertical dotted line.

Similar articles

Cited by

References

    1. Adams MD, Celniker SE, Holt RA, Evans CA, Gocayne JD, et al. The genome sequence of Drosophila melanogaster. Science. 2000;287:2185–2195. - PubMed
    1. Venter JC, Adams MD, Myers EW, Li PW, Mural RJ, et al. The sequence of the human genome. Science. 2001;291:1304–1351. - PubMed
    1. Lander ES, Linton LM, Birren B, Nusbaum C, Zody MC, et al. Initial sequencing and analysis of the human genome. Nature. 2001;409:860–921. - PubMed
    1. Biggin MD, Tjian R. Transcriptional regulation in Drosophila: the post-genome challenge. Funct Integr Genomics. 2001;1:223–234. - PubMed
    1. Davidson EH. Genomic regulatory systems: development and evolution. San Diego: Academic Press; 2001. 261

Publication types