

Expression of small breast epithelial mucin (SBEM) protein in tissue microarrays (TMAs) of primary invasive breast cancers
- PMID: 18269587
- PMCID: PMC2253716
- DOI: 10.1111/j.1365-2559.2007.02955.x
Expression of small breast epithelial mucin (SBEM) protein in tissue microarrays (TMAs) of primary invasive breast cancers
Abstract
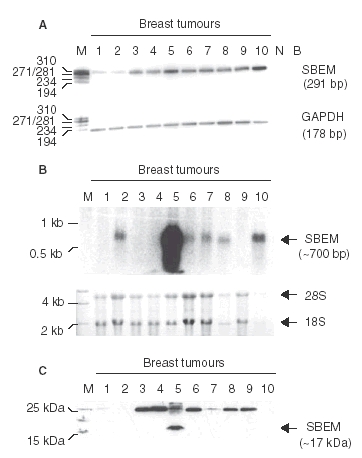
Aims: Small breast epithelial mucin (SBEM) is a recently described gene product that shows promise as a new breast biomarker. The aim was to investigate for the first time SBEM protein expression in a large cohort (n = 300) of invasive breast cancers, its relationship to established clinical variables and its association with clinical outcome.
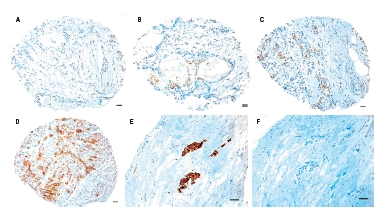
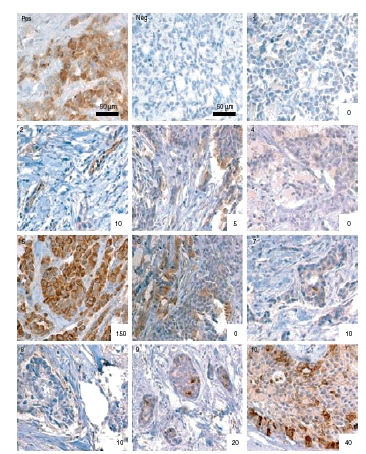
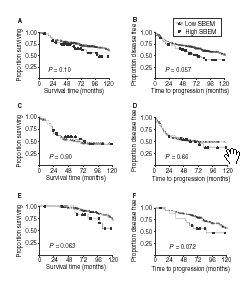
Methods and results: Immunohistochemical analysis was performed on tissue microarrays consisting of 149 oestrogen receptor (ER) alpha- and 151 ERalpha+ breast cancers. Overall, 18% of tumours were SBEM+ (n = 53/300). However, SBEM protein was more frequently observed in ER- (22%) than in ER+ cancers (13%; P = 0.049). A significant association with psoriasin/S100A7 expression (P < or = 0.0001) was observed in the entire cohort. SBEM was also positively associated with HER-2 (P = 0.046) in ER- cancers, and increased levels of SBEM were strongly associated with higher tumour grade (P = 0.0015). Furthermore, SBEM expression showed a trend towards an association with reduced overall survival and relapse-free survival in the ER+ cohort (P = 0.063 and P = 0.072, respectively).
Conclusions: Our results suggest that SBEM may identify a unique subset of breast cancers with poor prognosis and may have future implications for therapeutic management of this disease.
Figures
Similar articles
-
Small breast epithelial mucin tumor tissue expression is associated with increased risk of recurrence and death in triple-negative breast cancer patients.Diagn Pathol. 2013 May 1;8:71. doi: 10.1186/1746-1596-8-71. Diagn Pathol. 2013. PMID: 23635316 Free PMC article.
-
Diagnostic accuracy of small breast epithelial mucin mRNA as a marker for bone marrow micrometastasis in breast cancer: a pilot study.J Cancer Res Clin Oncol. 2009 Sep;135(9):1185-95. doi: 10.1007/s00432-009-0559-7. Epub 2009 Feb 17. J Cancer Res Clin Oncol. 2009. PMID: 19221791 Clinical Trial.
-
[Expression of small breast epithelial mucin mRNA in peripheral blood of breast cancer patients and its clinical significance].Ai Zheng. 2005 Jul;24(7):842-5. Ai Zheng. 2005. PMID: 16004812 Chinese.
-
Small breast epithelial mucin (SBEM) has the potential to be a marker for predicting hematogenous micrometastasis and response to neoadjuvant chemotherapy in breast cancer.Clin Exp Metastasis. 2010 Apr;27(4):251-9. doi: 10.1007/s10585-010-9323-2. Epub 2010 Apr 3. Clin Exp Metastasis. 2010. PMID: 20364301
-
Opposing functions of psoriasin (S100A7) and koebnerisin (S100A15) in epithelial carcinogenesis.Curr Opin Pharmacol. 2013 Aug;13(4):588-94. doi: 10.1016/j.coph.2013.04.007. Epub 2013 May 9. Curr Opin Pharmacol. 2013. PMID: 23664757 Free PMC article. Review.
Cited by
-
Targeting MUCL1 protein inhibits cell proliferation and EMT by deregulating β‑catenin and increases irinotecan sensitivity in colorectal cancer.Int J Oncol. 2022 Mar;60(3):22. doi: 10.3892/ijo.2022.5312. Epub 2022 Jan 21. Int J Oncol. 2022. PMID: 35059735 Free PMC article.
-
Steroid Receptor RNA Activator Protein (SRAP): a potential new prognostic marker for estrogen receptor-positive/node-negative/younger breast cancer patients.Breast Cancer Res. 2009;11(5):R67. doi: 10.1186/bcr2359. Breast Cancer Res. 2009. PMID: 19740422 Free PMC article.
-
Claudins 1, 3, and 4 protein expression in ER negative breast cancer correlates with markers of the basal phenotype.Virchows Arch. 2009 Jun;454(6):647-56. doi: 10.1007/s00428-009-0770-6. Epub 2009 Apr 23. Virchows Arch. 2009. PMID: 19387682
-
Breast tumors from CHEK2 1100delC-mutation carriers: genomic landscape and clinical implications.Breast Cancer Res. 2011 Sep 20;13(5):R90. doi: 10.1186/bcr3015. Breast Cancer Res. 2011. PMID: 21542898 Free PMC article.
-
Transcriptional profiling reveals gland-specific differential expression in the three major salivary glands of the adult mouse.Physiol Genomics. 2018 Apr 1;50(4):263-271. doi: 10.1152/physiolgenomics.00124.2017. Epub 2018 Jan 26. Physiol Genomics. 2018. PMID: 29373073 Free PMC article.
References
-
- International Agency for Research on Cancer . IARC Screening Group, Breast Cancer Research Studies. Available at http://www.iarc.fr.
-
- Parkin DM, Bray F, Ferlay J, Pisani P. Global cancer statistics. CA Cancer J. Clin. 2002;55:74–108. - PubMed
-
- Quiet CA, Ferguson DJ, Weichselbaum RR, Hellman S. Natural history of node-positive breast cancer: the curability of small cancers with a limited number of positive nodes. J. Clin. Oncol. 1996;14:3105–3111. - PubMed
-
- Ingle JN, Suman VJ, Kardinal CG, et al. A randomized trial of tamoxifen alone or combined with octreotide in the treatment of women with metastatic breast carcinoma. Cancer. 1999;85:1284–1292. - PubMed
-
- McGuire WL. Hormone receptors: their role in predicting prognosis and response to endocrine therapy. Semin. Oncol. 1978;5:428–433. - PubMed
Publication types
MeSH terms
Substances
LinkOut - more resources
Full Text Sources
Medical
Research Materials
Miscellaneous
