Genome-wide pattern of TCF7L2/TCF4 chromatin occupancy in colorectal cancer cells
- PMID: 18268006
- PMCID: PMC2293123
- DOI: 10.1128/MCB.02175-07
Genome-wide pattern of TCF7L2/TCF4 chromatin occupancy in colorectal cancer cells
Abstract
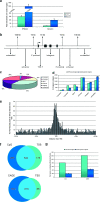
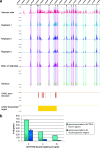
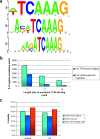
Wnt signaling activates gene expression through the induced formation of complexes between DNA-binding T-cell factors (TCFs) and the transcriptional coactivator beta-catenin. In colorectal cancer, activating Wnt pathway mutations transform epithelial cells through the inappropriate activation of a TCF7L2/TCF4 target gene program. Through a DNA array-based genome-wide analysis of TCF4 chromatin occupancy, we have identified 6,868 high-confidence TCF4-binding sites in the LS174T colorectal cancer cell line. Most TCF4-binding sites are located at large distances from transcription start sites, while target genes are frequently "decorated" by multiple binding sites. Motif discovery algorithms define the in vivo-occupied TCF4-binding site as evolutionarily conserved A-C/G-A/T-T-C-A-A-A-G motifs. The TCF4-binding regions significantly correlate with Wnt-responsive gene expression profiles derived from primary human adenomas and often behave as beta-catenin/TCF4-dependent enhancers in transient reporter assays.
Figures


Similar articles
-
A genome-wide screen for beta-catenin binding sites identifies a downstream enhancer element that controls c-Myc gene expression.Mol Cell Biol. 2008 Dec;28(24):7368-79. doi: 10.1128/MCB.00744-08. Epub 2008 Oct 13. Mol Cell Biol. 2008. PMID: 18852287 Free PMC article.
-
Serial analysis of chromatin occupancy identifies beta-catenin target genes in colorectal carcinoma cells.Proc Natl Acad Sci U S A. 2007 Feb 27;104(9):3324-9. doi: 10.1073/pnas.0611576104. Epub 2007 Feb 21. Proc Natl Acad Sci U S A. 2007. PMID: 17360646 Free PMC article.
-
Involvement of splicing factor-1 in beta-catenin/T-cell factor-4-mediated gene transactivation and pre-mRNA splicing.Gastroenterology. 2007 Mar;132(3):1039-54. doi: 10.1053/j.gastro.2007.01.007. Epub 2007 Jan 5. Gastroenterology. 2007. PMID: 17383426
-
Transcriptional Regulation of Wnt/β-Catenin Pathway in Colorectal Cancer.Cells. 2020 Sep 19;9(9):2125. doi: 10.3390/cells9092125. Cells. 2020. PMID: 32961708 Free PMC article. Review.
-
Colorectal cancer and genetic alterations in the Wnt pathway.Oncogene. 2006 Dec 4;25(57):7531-7. doi: 10.1038/sj.onc.1210059. Oncogene. 2006. PMID: 17143297 Review.
Cited by
-
VDR/RXR and TCF4/β-catenin cistromes in colonic cells of colorectal tumor origin: impact on c-FOS and c-MYC gene expression.Mol Endocrinol. 2012 Jan;26(1):37-51. doi: 10.1210/me.2011-1109. Epub 2011 Nov 22. Mol Endocrinol. 2012. PMID: 22108803 Free PMC article.
-
Prostaglandin E2 promotes the nuclear accumulation of lymphoid enhancer factor-1 in poorly differentiated breast cancer cells.Prostaglandins Other Lipid Mediat. 2012 Oct;99(1-2):9-14. doi: 10.1016/j.prostaglandins.2012.05.002. Epub 2012 May 29. Prostaglandins Other Lipid Mediat. 2012. PMID: 22652293 Free PMC article.
-
Molecular function of TCF7L2: Consequences of TCF7L2 splicing for molecular function and risk for type 2 diabetes.Curr Diab Rep. 2010 Dec;10(6):444-51. doi: 10.1007/s11892-010-0149-8. Curr Diab Rep. 2010. PMID: 20878273 Review.
-
Stable S/MAR-based episomal vectors are regulated at the chromatin level.Chromosome Res. 2010 Nov;18(7):757-75. doi: 10.1007/s10577-010-9165-4. Epub 2010 Nov 16. Chromosome Res. 2010. PMID: 21080054 Free PMC article.
-
The leukemia-associated Mllt10/Af10-Dot1l are Tcf4/β-catenin coactivators essential for intestinal homeostasis.PLoS Biol. 2010 Nov 16;8(11):e1000539. doi: 10.1371/journal.pbio.1000539. PLoS Biol. 2010. PMID: 21103407 Free PMC article.
References
-
- Batlle, E., J. Bacani, H. Begthel, S. Jonkheer, A. Gregorieff, M. van de Born, N. Malats, E. Sancho, E. Boon, T. Pawson, S. Gallinger, S. Pals, and H. Clevers. 2005. EphB receptor activity suppresses colorectal cancer progression. Nature 4351126-1130. - PubMed
-
- Batlle, E., J. T. Henderson, H. Beghtel, M. M. van den Born, E. Sancho, G. Huls, J. Meeldijk, J. Robertson, M. van de Wetering, T. Pawson, and H. Clevers. 2002. Beta-catenin and TCF mediate cell positioning in the intestinal epithelium by controlling the expression of EphB/ephrinB. Cell 111251-263. - PubMed
-
- Bernstein, B. E., M. Kamal, K. Lindblad-Toh, S. Bekiranov, D. K. Bailey, D. J. Huebert, S. McMahon, E. K. Karlsson, E. J. Kulbokas III, T. R. Gingeras, S. L. Schreiber, and E. S. Lander. 2005. Genomic maps and comparative analysis of histone modifications in human and mouse. Cell 120169-181. - PubMed
Publication types
MeSH terms
Substances
LinkOut - more resources
Full Text Sources
Other Literature Sources
Medical
