. 2008 Apr;19(4):1404-14.
doi: 10.1091/mbc.e07-10-1053. Epub 2008 Jan 30.

Galectin-1 is a novel structural component and a major regulator of h-ras nanoclusters

Affiliations

Galectin-1 is a novel structural component and a major regulator of h-ras nanoclusters

Liron Belanis et al. Mol Biol Cell. 2008 Apr.

Abstract

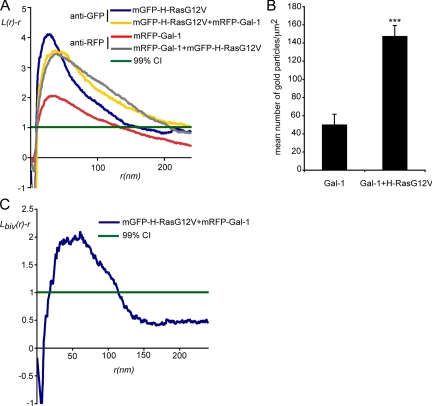
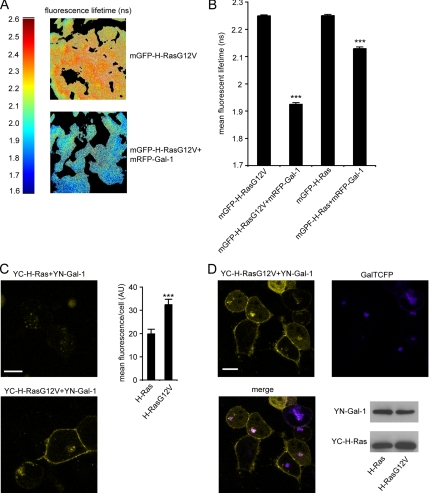
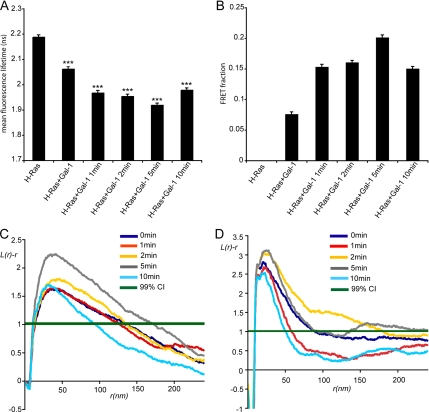
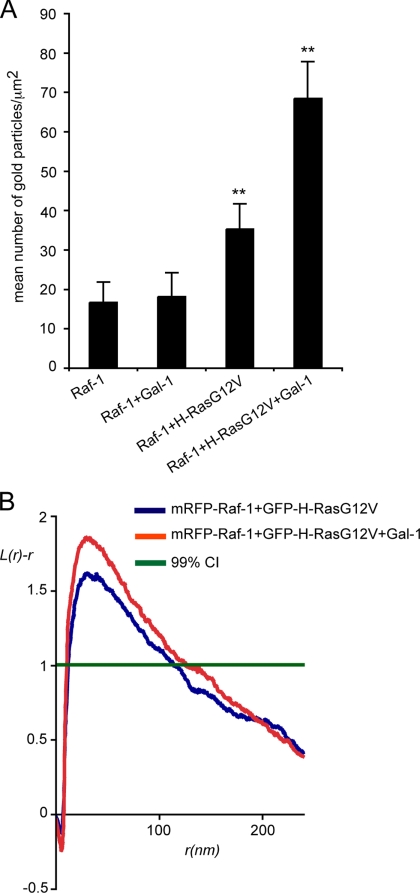
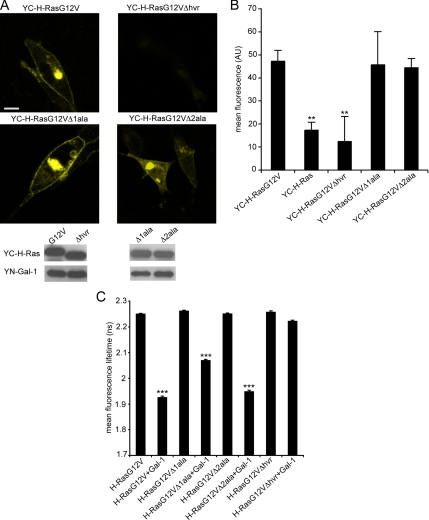
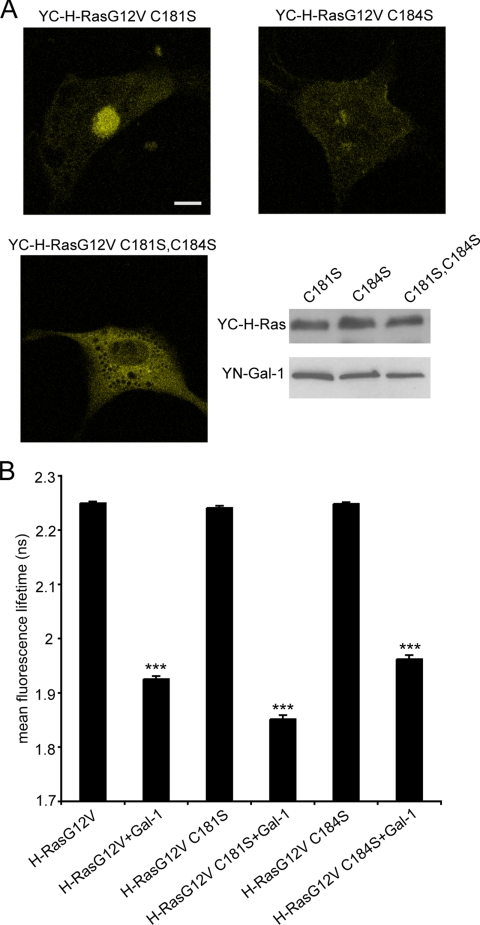
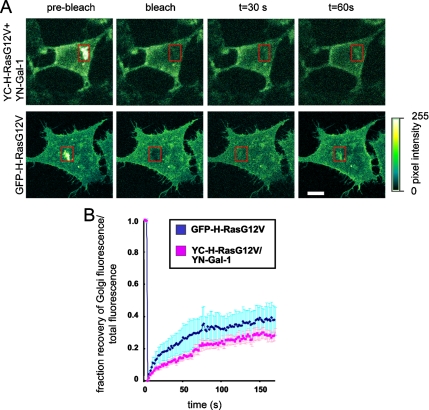
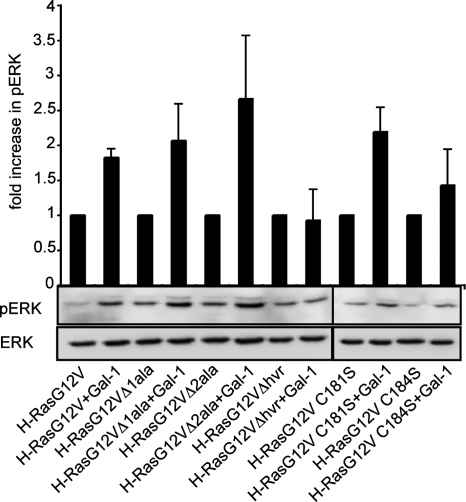
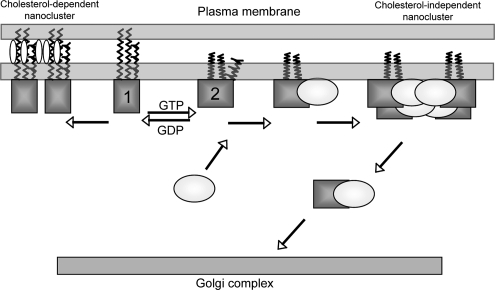
The organization of Ras proteins into nanoclusters on the inner plasma membrane is essential for Ras signal transduction, but the mechanisms that drive nanoclustering are unknown. Here we show that epidermal growth factor receptor activation stimulates the formation of H-Ras.GTP-Galectin-1 (Gal-1) complexes on the plasma membrane that are then assembled into transient nanoclusters. Gal-1 is therefore an integral structural component of the H-Ras-signaling nanocluster. Increasing Gal-1 levels increases the stability of H-Ras nanoclusters, leading to enhanced effector recruitment and signal output. Elements in the H-Ras C-terminal hypervariable region and an activated G-domain are required for H-Ras-Gal-1 interaction. Palmitoylation is not required for H-Ras-Gal-1 complex formation, but is required to anchor H-Ras-Gal-1 complexes to the plasma membrane. Our data suggest a mechanism for H-Ras nanoclustering that involves a dual role for Gal-1 as a critical scaffolding protein and a molecular chaperone that contributes to H-Ras trafficking by returning depalmitoylated H-Ras to the Golgi complex for repalmitoylation.


Figures

Figure 1.
Figure 1.
Gal-1 is a structural component of H-RasG12V nanoclusters. (A) Plasma membrane sheets were prepared from serum-starved cells expressing mRFP-Gal-1, mGFP-H-RasG12V, or expressing mRFP-Gal-1 and mGFP-H-RasG12V and labeled with anti-GFP or anti-mRFP antibodies conjugated to 5-nm gold. The spatial distribution of the resulting gold patterns was analyzed by Ripley's K-function. L(r) − r values above the 99% confidence interval (99% CI) for complete spatial randomness (CSR) indicate clustering at the value of r. The maximum value of L(r) − r occurs at supr. Coexpression of mGFP-H-RasG12V significantly increases Lmax and supr of the mRFP-Gal-1 pattern (p = 0.001). Clustering of mGFP-H-RasG12V was significantly changed when coexpressed with mRFP-Gal-1 (p = 0.001). K-functions are weighted means (n ≥ 8) standardized on the 99% CI. Statistical significance was assessed using bootstrap tests. (B) Plasma membrane recruitment of mRFP-Gal-1 in the presence or absence of mGFP-H-RasG12V. Plasma membrane sheets were labeled with anti-mRFP antibody conjugated to 5-nm gold and the level of gold labeling/μm2 was calculated. The graph shows means (± SEM, n = 8–19), significance differences were assessed in t tests. Expression of H-RasG12V significantly increases Gal-1 membrane recruitment (***p < 0.001). (C) Colocalization of mRFP-Gal-1 and mGFP-H-RasG12V. Plasma membrane sheets generated from cells expressing mRFP-Gal-1 and mGFP-H-RasG12V were colabeled with anti-mRFP (2 nm gold) and anti-GFP (6 nm gold) antibodies. Lbiv(r) − r curves above the 99% CI indicate significant colocalization. The bivariate K-functions are weighted means (n = 5) standardized on the 99% CI.
Figure 2.
Figure 2.
Gal-1 interacts preferentially with H-Ras.GTP. BHK cells expressing mGFP-H-Ras or mGFP-H-RasG12V, alone, or with mRFP-Gal-1 were imaged in the frequency domain in a wide-field FLIM-FRET microscope. (A) Representative heat map images of the cells showing fluorescence lifetime of mGFP-H-RasG12V in presence or absence of mRFP-Gal-1. (B) Mean fluorescence lifetime of mGFP (± SEM) measured in 54–132 cells. Significant differences from control mGFP-H-RasG12V or mGFP-H-Ras lifetimes were assessed using t tests (***p ≪ 0.0001). (C) HEK 293 or BHK cells were cotransfected with YC-H-Ras and YN-Gal-1 or with YC-H-RasG12V and YN-Gal-1 and imaged by fluorescence confocal microscopy. The resulting BiFC indicates a strong direct interaction of H-RasG12V with Gal-1 in the plasma membrane and the Golgi complex. Typical YFP images of the HEK 293 cotransfectants are shown (left panel; bar, 10 μm). Similar images were obtained with the BHK cotransfectants (not shown). The graph shows mean cell fluorescence intensity of YC-H-RasG12V/YN-Gal-1 compared with YC-H-Ras/YN-Gal-1 (±SEM, n = 30), ***p < 0.0001 evaluated in t tests. (D) HEK 293 cells were cotransfected with YC-H-RasG12V/YN-Gal-1/GalTCFP and imaged by dual fluorescence confocal microscopy. Typical YFP and CFP images and their overlay show colocalization of YC-H-RasG12V/YN-Gal-1 complexes and the Golgi marker GalT-CFP. Representative immunoblots confirming similar transfection efficiencies are shown.
Figure 3.
Figure 3.
EGF stimulation induces dynamic interaction between H-Ras.GTP and Gal-1. (A) BHK cells expressing mGFP-H-Ras and mRFP-Gal-1 were serum-starved and stimulated with 50 ng/ml EGF for the indicated time points. The fluorescence lifetime of mGFP-H-Ras in the absence of mRFP-Gal-1 in serum free conditions was used as a control. Fluorescence lifetime was measured in multiple cells, the graph shows mean values ± SEM (n = 22–84), pairwise significant differences from control mGFP-H-Ras were evaluated in t tests (***p ≪ 0.0001). (B) Global analysis and calibration with an mGFP-mRFP fusion protein was used to calculated the fraction of mGFP-H-Ras molecules undergoing FRET. Bars, mean FRET fraction ± SEM calculated for the cells imaged in A. (C) Spatial analysis of Gal-1 nanoclustering in response to EGF stimulation. BHK cells expressing mRFP-Gal-1 and mGFP-H-Ras were serum-starved and stimulated with 50 ng/ml EGF for the indicated time points. Plasma membrane sheets were labeled with anti-mRFP antibody conjugated to 5-nm gold. K-functions are weighted means (n ≥ 9) standardized on the 99% CI. Statistical significance was assessed in bootstrap tests. The analysis shows that Gal-1 nanoclustering is significantly increased after 5 min of EGF stimulation compared with the untreated control (p = 0.001). (D) Spatial analysis of H-Ras nanoclustering in response to EGF stimulation. BHK cells expressing mRFP-Gal-1 and mGFP-H-Ras were serum-starved and stimulated with 50 ng/ml EGF for the indicated time points. Plasma membrane sheets were labeled with anti-GFP antibodies conjugated to 5-nm gold. K-functions are weighted means (n ≥ 7) standardized on the 99% CI. Statistical significance was assessed in bootstrap tests. The analysis revealed that H-Ras nanoclustering was significantly increased after 2–5 min of EGF stimulation (p = 0.001).
Figure 4.
Figure 4.
Gal-1 expression increases Raf-1 recruitment to H-RasG12V nanoclusters. Plasma membrane sheets generated from serum-starved BHK cells expressing mRFP-Raf-1, mRFP-Raf-1 and Gal-1, mGFP-H-RasG12V and mRFP-Raf-1, or mGFP-H-RasG12V, mRFP-Raf-1, and Gal-1 were labeled with anti-mRFP antibody conjugated to 5-nm gold to monitor mRFP-Raf-1 plasma membrane interaction. (A) Analysis of Raf-1 membrane recruitment demonstrates that H-RasG12V recruits significantly more mRFP-Raf-1 to the plasma membrane in the presence of Gal-1. Bars, number of gold particles/μm2; error bars, ±SEM (n = 11, 15, 15, and 16, respectively). Statistical significance of differences was assessed in t tests (**p = 0.01). (B) EM spatial mapping of Raf-1 recruited to the plasma membrane by H-RasG12V in the presence or absence of Gal-1. K-function analysis of the gold patterns generated in A shows that Raf-1 nanoclustering is significantly increased when Gal-1 and H-RasG12V are coexpressed compared with H-RasG12V alone (p = 0.001). K-functions are weighted means (n ≥ 15) standardized on the 99% CI. Statistical significance was assessed in bootstrap tests.
Figure 5.
Figure 5.
The H-Ras HVR regulates interaction with Gal-1. (A) BHK cells were cotransfected with YC-H-RasG12V and YN-Gal-1, YC-H-RasG12VΔhvr and YN-Gal-1, YC-H-RasG12VΔ1ala and YN-Gal-1, or YC-H-RasG12VΔ2ala and YN-Gal-1. Cells were imaged by fluorescence confocal microscopy 48 h after cotransfection. Typical images are shown in the top panel and expression levels in the bottom panel. Images collected from 20 cells in three different experiments exhibited similar patterns of BiFC localization. Bar, 10 μm. (B) The mean fluorescence levels of HEK 293 cells expressing YN-Gal-1/YC-H-RasG12V HVR mutants or YN-Gal-1/YC-H-Ras were quantified by FACS analysis. The mean fluorescence obtained from three different experiments is shown (mean ± SEM). **p < 0.001, YC-H-Ras compared with YC-H-RasG12V, or YC-H-RasG12VΔhvr compared with YC-H-RasG12V. Immunoblot analysis confirmed similar transfection efficiencies. (C) BHK cells were cotransfected with mGFP-H-RasG12V or mGFP-H-RasG12V HVR mutants in the presence or absence of mRFP-Gal-1, and the fluorescence lifetime of mGFP was measured. Bars, mean fluorescence lifetime of mGFP (± SEM, n = 53–132 cells). Pairwise differences from the control mGFP-H-RasG12V were analyzed in t tests (***p ≪ 0.0001).
Figure 6.
Figure 6.
Palmitoylation is dispensable for Gal-1 H-RasG12V interaction. (A) BHK cells cotransfected with YC-H-RasG12V C181S and YN-Gal-1, YC-H-RasG12V C184S and YN-Gal-1, or YC-H-RasG12V C181S,C184S and YN-Gal-1 were imaged by fluorescent confocal microscopy, 48 h after cotransfection. Typical BiFC images of the cotransfectants are shown in the top panel and expression levels in the bottom panel. Images collected from 20 cells in three different experiments exhibited similar patterns of BiFC localization. Bar, 10 μm. (B) BHK cells were cotransfected with mGFP-H-RasG12V, or mGFP-H-RasG12V palmitoylation mutants in the presence or absence of mRFP-Gal-1, and the fluorescence lifetime of mGFP was measured. Bars, the mean fluorescence lifetime of mGFP (±SEM, n = 44–132 cells). Pairwise statistical significance from the control mGFP-H-RasG12V was analyzed by t tests (***p ≪ 0.0001).
Figure 7.
Figure 7.
Gal-1 and H-RasG12V complexes translocate from the plasma membrane to the Golgi complex. BHK cells expressing GFP-H-RasG12V or coexpressing YC-H-RasG12V and YN-Gal-1 were imaged live by fluorescence confocal microscopy before and after photobleaching of the Golgi complex (marked by a red rectangle). (A) Typical images of a GFP-H-RasG12V–transfected cell, or YC-H-RasG12V/ YN-Gal-1 cotransfectant before, immediately after, and 30 and 60 s after photobleaching are shown. Color-coded pixel intensities are shown in the right panel. Bar, 10 μm. (B) FRAP of GFP-H-RasG12V or of YC-H-RasG12V-YN-Gal-1 complexes in the Golgi as a function of time. Data represent the mean (±SEM, n = 4) of the normalized Golgi/total cell fluorescence calculated as detailed in Material and Methods. The half times of fluorescence recoveries, calculated by fitting the data to a single exponent, were 50 ± 10 s for GFP-H-RasG12V and 30 ± 12 s for the YC-H-RasG12V-YN-Gal-1 complexes.
Figure 8.
Figure 8.
Gal-1 interaction with H-RasG12V increases pERK activation. Analysis of ability of Gal-1 to potentiate activation of pERK induced by H-RasG12V and the H-RasG12V deletion mutants. BHK cells were cotransfected with equivalent levels of the GFP-H-RasG12V mutant constructs shown in the presence or absence of Gal-1. Twenty micrograms of whole cell lysate was subjected to SDS-PAGE, followed by immunoblotting with antibodies against pERK, ERK, and Ras. Immunoblots visualized by ECL were quantified using Lumi-Imager F1 software (Roche). Bars, the mean fold increase in pERK levels in the presence of Gal-1 relative to the absence of Gal-1 for each pair of cotransfectants from two independent experiments (±SEM). Typical immunoblot of the pERK and ERK levels are shown.
Figure 9.
Figure 9.
A role for Gal-1 in H-Ras GTP-dependent lateral segregation. Based on MD models of H-Ras on a lipid bilayer (Gorfe et al., 2007) we propose that H-Ras (depicted as squares) on the plasma membrane also exists in two conformational states that are characterized by different modes of membrane interaction. On GDP-loading, H-Ras preferentially assumes a conformational state that is characterized by extended, deeply embedded acyl chains (model 1). This conformation may be stabilized by interaction with cholesterol, leading to the formation of H-Ras.GDP cholesterol-dependent nanoclusters. On GTP-loading H-Ras preferentially adopts a conformational state (model 2) with a larger protein membrane interfacial area and more flexible acyl chains. In this conformation the farnesyl group is also less deeply inserted into the bilayer. On growth factor activation, H-Ras.GTP preferentially assumes this conformation allowing interaction of the farnesyl group with the prenyl-binding pocket of Gal-1 (Gal-1 is depicted as a circle). The interaction of Gal-1 with H-Ras requires the HVR, which provides the appropriate spacing between the G-domain and the farnesyl group. After interaction of the farnesyl group with the prenyl-binding pocket of Gal-1, the palmitate group at C184 is the primary component regulating the lateral segregation of H-Ras into cholesterol-independent domains. Interaction with Gal-1 stabilizes the H-Ras.GTP conformation enabling the H-Ras.GTP-Gal-1 complexes to act as the building blocks for the H-Ras.GTP nanocluster, which is the signaling platform for the recruitment of downstream effectors. After depalmitoylation of H-Ras, Gal-1, by shielding the hydrophobic farnesyl group, acts as a chaperone to promote free diffusion of H-Ras from the plasma membrane through the cytosol to the Golgi complex.

Similar articles

Cited by

References

    1. Apolloni A., Prior I. A., Lindsay M., Parton R. G., Hancock J. F. H-ras but not K-ras traffics to the plasma membrane through the exocytic pathway. Mol. Cell. Biol. 2000;20:2475–2487. - PMC - PubMed
    1. Ashery U., Yizhar O., Rotblat B., Elad-Sfadia G., Barkan B., Haklai R., Kloog Y. Spatiotemporal organization of Ras signaling: rasosomes and the galectin switch. Cell. Mol. Neurobiol. 2006;26:469–493. - PubMed
    1. Bivona T. G., et al. PKC regulates a farnesyl-electrostatic switch on K-Ras that promotes its association with Bcl-XL on mitochondria and induces apoptosis. Mol. Cell. 2006;21:481–493. - PubMed
    1. Bracha-Drori K., Shichrur K., Katz A., Oliva M., Angelovici R., Yalovsky S., Ohad N. Detection of protein-protein interactions in plants using bimolecular fluorescence complementation. Plant J. 2004;40:419–427. - PubMed
    1. Chiu V. K., Bivona T., Hach A., Sajous J. B., Silletti J., Wiener H., Johnson R. L., 2nd, Cox A. D., Philips M. R. Ras signalling on the endoplasmic reticulum and the Golgi. Nat. Cell Biol. 2002;4:343–350. - PubMed

Publication types

MeSH terms