. 2008 Jan 28:8:10.
doi: 10.1186/1471-213X-8-10.

Bunched, the Drosophila homolog of the mammalian tumor suppressor TSC-22, promotes cellular growth

Affiliations

Bunched, the Drosophila homolog of the mammalian tumor suppressor TSC-22, promotes cellular growth

Silvia Gluderer et al. BMC Dev Biol. .

Abstract

Background: Transforming Growth Factor-beta1 stimulated clone-22 (TSC-22) is assumed to act as a negative growth regulator and tumor suppressor. TSC-22 belongs to a family of putative transcription factors encoded by four distinct loci in mammals. Possible redundancy among the members of the TSC-22/Dip/Bun protein family complicates a genetic analysis. In Drosophila, all proteins homologous to the TSC-22/Dip/Bun family members are derived from a single locus called bunched (bun).

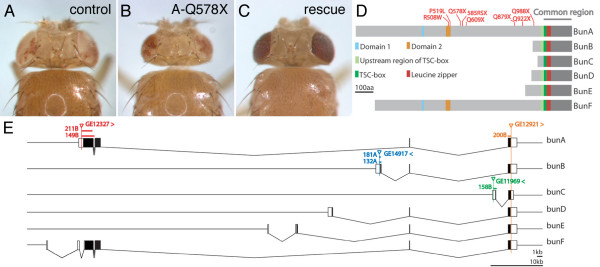
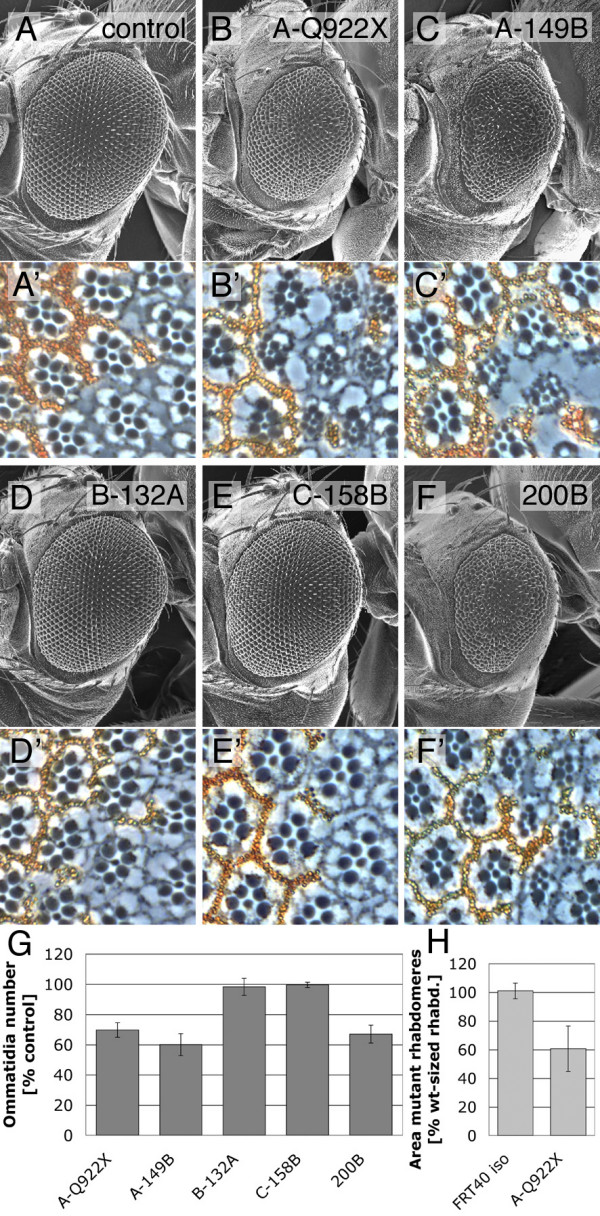
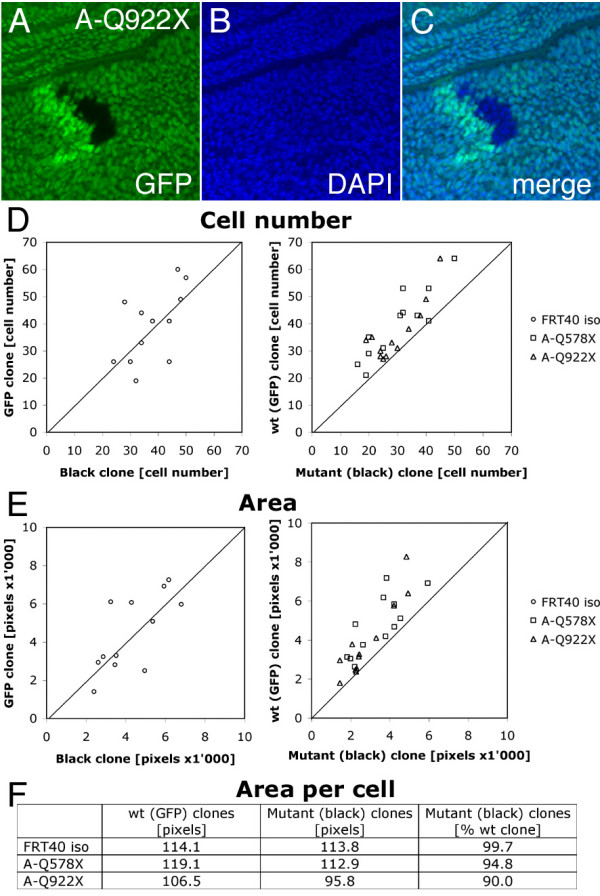
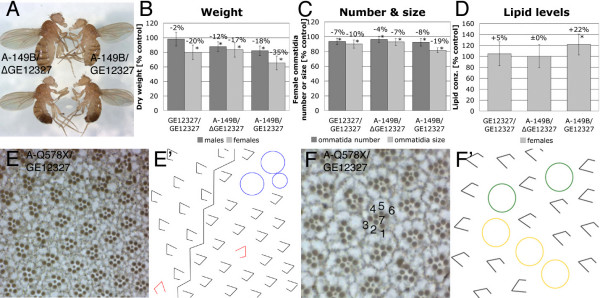
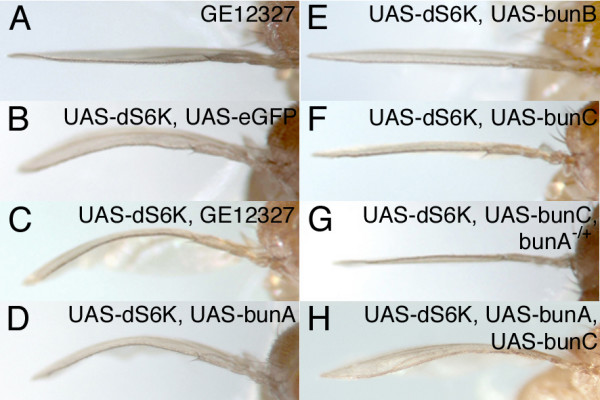
Results: We have identified bun in an unbiased genetic screen for growth regulators in Drosophila. Rather unexpectedly, bun mutations result in a growth deficit. Under standard conditions, only the long protein isoform BunA - but not the short isoforms BunB and BunC - is essential and affects growth. Whereas reducing bunA function diminishes cell number and cell size, overexpression of the short isoforms BunB and BunC antagonizes bunA function.

Conclusion: Our findings establish a growth-promoting function of Drosophila BunA. Since the published studies on mammalian systems have largely neglected the long TSC-22 protein version, we hypothesize that the long TSC-22 protein is a functional homolog of BunA in growth regulation, and that it is antagonized by the short TSC-22 protein.


Figures

Figure 1
Figure 1
Identification of bunA as positive growth regulator. Eye-specific reduction of bunA function by means of eyFLP/FRT-mediated mitotic recombination results in a reduction of eye and head size (B) as compared to the control (A). This growth deficit is rescued by overexpression of a bunA transgene (C). (D) Schematic representation of the six Bun protein isoforms. The putative Bun transcription factors have distinct N-termini but an identical C-terminal region (common region), including the TSC-box (DNA-binding) and an adjacent leucine zipper (homo- and heterodimerization) encoded by the very 3' bun exon (E). All Bun isoforms except for BunC also contain a conserved region N-terminally to the TSC-box that is present in all mammalian TSC-22/Dip/Bun family members. In addition, BunA and BunF possess two domains in their N-terminal regions that are conserved among mammalian homologs ([13], domain 1 aligns to BunA amino acids 369-82 [Swissprot:Q24523-1]). The eight EMS-induced mutations isolated in the eyFLP/FRT screen (indicated in red) affect only BunA and BunF. (E) The genomic region of bun according to FlyBase [39]. The six bun transcripts share the last exon but have distinct 5' exons. UTRs are shown in white and ORFs in black. P-element insertions used for the jump-out screens and deletions obtained in these screens are indicated. Arrowheads indicate the directions of transcription that can be driven by the respective EP insertions. The P-element GE12327 and the deletions derived from it as well as the EMS-induced alleles affect both bunA and bunF but are referred to as bunA alleles. Genotypes are: (A) y, w, eyFLP/y, w; FRT40A, w+, cl2L3/FRT40Aiso; (B) y, w, eyFLP/y, w; FRT40A, w+, cl2L3/FRT40A, bunA-Q578X; (C) y, w, eyFLP/y, w; FRT40A, w+, cl2L3/FRT40A, bunA-Q578X; ey-Gal4, GMR-Gal4/UAS-bunA.
Figure 2
Figure 2
The bunA growth phenotype. (A-F) SEM pictures of mosaic eyes generated with the eyFLP/FRT system. The alleles used are indicated. A precise excision of the P-element GE12921 serves as control (A). Eyes largely homozygous for bunA mutations (B and C) and for the deletion allele 200B (F) are small. (A'-F') Tangential sections of mosaic eyes containing homozygous mutant photoreceptors (marked by the lack of pigmentation) surrounded by heterozygous (and therefore wild-type sized) photoreceptors. A cell size reduction is apparent in clones of bunA mutant cells (B', C', and F'). bunB (D') and bunC (E') mutant photoreceptors do not differ from control photoreceptors. (H) Rhabdomere size is 40% decreased in bunA mutant ommatidia (B', only clones without differentiation defects were analyzed). The area enclosed by the rhabdomeres of photoreceptors R1-6 in unpigmented mutant ommatidia relative to neighboring pigmented ommatidia was measured (n = 7). Clones were induced early during development (24–48 h after egg deposition (AED)) using the hsFLP/FRT technique. (G) Statistical analysis of ommatidia number in mosaic eyes (n = 6) relative to control lines (n = 6, FRT40Aiso is used as control for EMS-induced bunA alleles, and precise excisions of the respective P-element insertions for the deletion alleles). Mosaic eyes largely consisting of bunB and bunC mutant clones have a normal number of ommatidia. Eyes from female flies were examined in all analyses.
Figure 3
Figure 3
Cell number and cell size are reduced in bunA mutant tissue. (A-C) A part of a wing imaginal disc containing a twin-spot clone is shown. The clone of bunA homozygous mutant cells (black) and its wild-type sister clone (bright green) were induced by the FLP/FRT recombination system (genotype y, w, hsFLP/y, w; FRT40A, Ubi-GFP/FRT40A, bunA-Q922X, heat shock for 25 min at 34°C 24–48 h AED), and larvae were dissected 51–52 h after induction of mitotic recombination. (B) Nuclei are visualized by DAPI staining. (D-E) Statistical analyses of twin-spot clones (n = 12 for every genotype). Control clones (FRT40Aiso) contain roughly the same number of cells (38 ± 7) as their sister clones (39 ± 13) and cover a comparable area (4291 ± 1506 and 4471 ± 1976 pixels, respectively; data points are evenly distributed around the straight line with the slope m = 1). However, cell number and clone area are reduced in bunA mutant clones (shift of data points). Homozygous mutant A-Q578X and A-Q922X clones contain significantly (p ≤ 0.05) fewer cells (30 ± 11 and 30 ± 8, respectively) than their sister clones (40 ± 13 and 37 ± 11, respectively). The areas covered by A-Q578X and A-Q922X mutant clones (3424 ± 1256 and 2826 ± 1216 pixels, respectively) are smaller than the areas covered by their sister clones (4785 ± 1516 and 3903 ± 1939 pixels, respectively; p = 0.013 and p = 0.06). The effect on clone area is slightly more pronounced than the effect on cell number, indicating a decrease in size of bunA mutant cells. (F) The average area of the bunA mutant cells is 5% (A-Q578X) and 10% (A-Q922X) smaller than the average area of the wild-type sister cells.
Figure 4
Figure 4
Viable bunA mutant flies are small, have elevated lipid levels, and display eye differentiation defects. The EP-element GE12327 inserted in the 5' UTR of bunA (intron of bunF; Figure 1E) is a hypomorphic bunA allele and gives rise to adult flies either homozygous or in combination with bunA alleles. (A) Homozygous bunA mutant females (top right) are smaller than heterozygous females (top left). A precise excision line of GE12327, termed ΔGE12327, serves as control. (B-D) Statistical analyses of weight, ommatidial size and number, and lipid levels of hypomorphic bunA mutants. All results are shown relative to values of GE12327/ΔGE12327 control flies (= 100%). Significant changes (p ≤ 0.05) are marked by asterisks. The allele A-211B behaved akin to A-149B in all assays. (B) Flies with reduced bunA function are lighter than control flies. Allele A-149B affects body weight in a dominant manner. 100% corresponds to 0.370 mg in females and 0.197 mg in males, respectively; n ≥ 35. (C) Eyes of hypomorphic bunA mutant females contain fewer and smaller ommatidia, indicating that both cell number and cell size are reduced. Again, allele A-149B dominantly lowers ommatidia number and size. 100% corresponds to 727 ommatidia; n = 8. (D) Females with severely lowered bunA function (A-149B/GE12327) have elevated lipid contents. 100% = 0.697 cal/mg fresh weight; n = 10. (E and F) Tangential eye sections of A-Q578X/GE12327 females reveal differentiation defects, schematically illustrated in (E' and F'). (E') The zigzag line demarcates the equator. Underrotated ommatidia are shown in red, and blue circles indicate fused ommatidia. (F') Yellow circles represent R7 to R1/6 transformations, and green circles indicate R4 to R3 transformations.
Figure 5
Figure 5
bunB and bunC can interfere with bunA function. (A-H) Side view of wings overexpressing the indicated UAS transgenes under the control of the apterous-Gal4 (ap-Gal4) driver line. (A) EP-mediated expression of bunA does not produce a wing bending phenotype. (B) Overexpression of dS6K in the dorsal wing compartment leads to wing bending (eGFP was co-expressed as a control). The dS6K bent-down wing phenotype is enhanced when the EP-insertion GE12327 (C) or a UAS-bunA transgene (D) is used to co-overexpress bunA. Expression of bunA from the EP consistently results in stronger phenotypes than from the UAS-bunA transgene. (E) Co-overexpression of bunB leads to a complete suppression of the dS6K bent-down wing phenotype. (F) Expression of bunC suppresses the dS6K bent-down wing phenotype, and the suppression is even stronger when a copy of bunA is removed (G), indicative of a dominant negative effect of bunC on bunA. Consistently, co-expression of bunA interferes with the suppressing effect of bunC (H).

Similar articles

Cited by

References

    1. Hanahan D, Weinberg RA. The hallmarks of cancer. Cell. 2000;100:57–70. doi: 10.1016/S0092-8674(00)81683-9. - DOI - PubMed
    1. Shibanuma M, Kuroki T, Nose K. Isolation of a gene encoding a putative leucine zipper structure that is induced by transforming growth factor beta 1 and other growth factors. J Biol Chem. 1992;267:10219–10224. - PubMed
    1. Ohta S, Shimekake Y, Nagata K. Molecular cloning and characterization of a transcription factor for the C-type natriuretic peptide gene promoter. Eur J Biochem. 1996;242:460–466. doi: 10.1111/j.1432-1033.1996.460rr.x. - DOI - PubMed
    1. Iida M, Anna CH, Holliday WM, Collins JB, Cunningham ML, Sills RC, Devereux TR. Unique patterns of gene expression changes in liver after treatment of mice for 2 weeks with different known carcinogens and non-carcinogens. Carcinogenesis. 2005;26:689–699. doi: 10.1093/carcin/bgi005. - DOI - PubMed
    1. Shostak KO, Dmitrenko VV, Garifulin OM, Rozumenko VD, Khomenko OV, Zozulya YA, Zehetner G, Kavsan VM. Downregulation of putative tumor suppressor gene TSC-22 in human brain tumors. J Surg Oncol. 2003;82:57–64. doi: 10.1002/jso.10180. - DOI - PubMed

Publication types

Substances

LinkOut - more resources