. 2008 Jan 16;28(3):598-611.
doi: 10.1523/JNEUROSCI.4609-07.2008.

Glial dysfunction in parkin null mice: effects of aging

Affiliations

Glial dysfunction in parkin null mice: effects of aging

Rosa M Solano et al. J Neurosci. .

Abstract

Parkin mutations in humans produce parkinsonism whose pathogenesis is related to impaired protein degradation, increased free radicals, and abnormal neurotransmitter release. The role of glia in parkin deficiency is little known. We cultured midbrain glia from wild-type (WT) and parkin knock-out (PK-KO) mice. After 18-20 d in vitro, PK-KO glial cultures had less astrocytes, more microglia, reduced proliferation, and increased proapoptotic protein expression. PK-KO glia had greater levels of intracellular glutathione (GSH), increased mRNA expression of the GSH-synthesizing enzyme gamma-glutamylcysteine synthetase, and greater glutathione S-transferase and lower glutathione peroxidase activities than WT. The reverse happened in glia cultured in serum-free defined medium (EF12) or in old cultures. PK-KO glia was more susceptible than WT to transference to EF12 or neurotoxins (1-methyl-4-phenylpyridinium, blockers of GSH synthesis or catalase, inhibitors of extracellular signal-regulated kinase 1/2 and phosphatidylinositol 3 kinases), aging of the culture, or combination of these insults. PK-KO glia was less susceptible than WT to Fe2+ plus H2O2 and less responsive to protection by deferoxamine. Old WT glia increased the expression of heat shock protein 70, but PK-KO did not. Glia conditioned medium (GCM) from PK-KO was less neuroprotective and had lower levels of GSH than WT. GCM from WT increased the levels of dopamine markers in midbrain neuronal cultures transferred to EF12 more efficiently than GCM from PK-KO, and the difference was corrected by supplementation with GSH. PK-KO-GCM was a less powerful suppressor of apoptosis and microglia in neuronal cultures. Our data prove that abnormal glial function is critical in parkin mutations, and its role increases with aging.


Figures

Figure 1.
Figure 1.
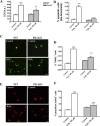
Characterization of glial mesencephalic cultures from WT and parkin null mice after 20 DIV. Glial cultures were maintained in DMEM–FCS medium. A, Photomicrographs of glial cells staining for type 2 astrocytes, with anti-GFAP+, microglial cells (CD11b+), and nuclei (bis-benzimide) in PK-KO midbrain glial cultures. Scale bar, 30 μm. B, Immunodetection and densitometric analysis of astroglial (GFAP) protein by Western blot. C, Percentage of microglial cells present in WT and PK-KO cultures. Photomicrographs (D) and percentage of proliferating cells (BrdU+) and total nuclei (E) stained with bis-benzimide of WT and PK-KO cells present in glial cultures incubated, with BrdU for 24 h, 3 d after reseeding. Scale bar, 20 μm. F, Immunodetection and densitometric analysis of the proapoptotic and antiapoptotic proteins, BclxL/S present in WT and PK-KO glial cultures. Values for immunocytochemistry studies are expressed as the mean ± SEM from six replicates of four independent cultures. Values for Western blotting experiment are the mean ± SEM from four replicates of two independent cultures. Statistical analysis was performed by one-way ANOVA, followed by Newman–Keuls multiple comparison test. +p < 0.05; ++p < 0.01, PK-KO versus WT cultures.
Figure 2.
Figure 2.
Glutathione homeostasis and detoxification enzyme activities in WT and PK-KO glial cultures. Glial cultures at 20–30 DIV were assayed for glutathione levels, γ-glutamylcysteine synthetase mRNA, and detoxification enzyme activities. A, Intracellular glutathione content, expressed as nanograms of GSH per microgram of protein. B, γ-GCS mRNA levels in WT and PK-KO glial cultures. C, Specific activities of GPx and catalase enzymes. D, GST activity in WT and PK-KO glial cultures. The activities of the detoxification enzymes were normalized to the total protein content. Values are the mean ± SEM of two or four independent cultures with six replicates each. Statistical analysis was performed by one-way ANOVA, followed by Newman–Keuls multiple comparison test. +p < 0.05; ++p < 0.01, PK-KO versus WT cultures.
Figure 3.
Figure 3.
Effects of oxidative stress inductors on WT and PK-KO glial cultures. WT and PK-KO cultures of 20–30 DIV growing in DMEM plus 15% FCS were used. A, Levels of GSH in WT and PK-KO glial cultures incubated in growth medium (DMEM–FCS) or 24 h incubation in a chemically defined serum free medium (EF12). Percentage of necrotic (propidium iodide+) cells (B), percentage of apoptotic (TUNEL+) cells (C), and LDH activity (D) in WT and PK-KO glial cultures incubated for 24, 52, and 72 h in EF12 medium. Photomicrographs (E) and optical intensity (F) showing the immunoreactivity of astroglial (GFAP+) cells in WT and PK-KO cultures incubated in growth medium or 24 h incubation in EF12 medium. Scale bar, 30 μm. G, LDH activity in WT and PK-KO glial cultures incubated with MPP+ (30 μm) for 24, 52, and 72 h in EF12 medium. H, Hydrogen peroxide released after 24 h incubation with EF12 or MPP+ (30 μm) in defined medium. Values are the mean ± SEM of two independent cultures with six replicates each. Statistical analysis was performed by two-way ANOVA (the interaction between genotype and change of medium or treatment was p < 0.01), followed by Bonferroni's post hoc test. +p < 0.05; ++p < 0.01; +++p < 0.001, PK-KO versus WT cultures. *p < 0.05; **p < 0.01; ***p < 0.001, treated cultures versus controls.
Figure 4.
Figure 4.
Resistance to oxidative stress. WT and PK-KO cultures of 30 DIV growing in DEM plus 15% FCS were used; 6–7 d after reseeding WT and PK-KO glial cultures were treated with increasing doses (50–200 μm) of H2O2 for 3 h in EMEM plus d-glucose medium. Mitochondrial (A) and LDH activities (B) were measured. C, Glutathione levels measured after 10, 30, and 60 min of H2O2 (200 μm) treatment. D, Effect of inhibitors of hydrogen peroxide metabolization on the cell death induced by H2O2. The cultures were preexposed to the GSH synthesis inhibitor BSO (40 μm) for 24 h, the catalase activity inhibitor 3AT (10 mm) for 2 h, or a combination of both agents, then H2O2 was added for 3 h at 100 μm, and mitochondrial activity were measured by MTT assay. Values are the mean ± SEM of three independent cultures with six replicates each. Statistical analysis was performed by two-way ANOVA (the interaction between genotype and treatment was p < 0.05), followed by Bonferroni's post hoc test. +p < 0.05; ++p < 0.01, PK-KO versus WT cultures. *p < 0.05; **p < 0.01; ***p < 0.001, H2O2-treated cultures versus controls. ΔΔΔp < 0.001 versus the corresponding H2O2 treatment without inhibitors. δδδp < 0.001 BSO plus 3AT treatment versus BSO or 3AT treatment alone.
Figure 5.
Figure 5.
Signaling pathways involved in the H2O2-induced cell death in WT and PK-KO glial cultures. Glial cultures maintained during 20–30 DIV in DMEM plus 15% FCS were used for these experiments; 6–7 d after reseeding, the medium was changed to EMEM plus d-glucose. Then the cultures were treated with H2O2 for 3 h. A, Thirty minutes before H2O2 (200 μm) treatment, preestablished groups received the ERK 1/2 inhibitor PD 98059 (15 μm), the PI3K inhibitor LY-294002 (25 μm), or solvent, and cell viability was measured by MTT assay and presented as a percentage versus control. B, Western blot and densitometric analysis showing the time course activation of p-ERK 1/2 in WT and PK-KO glial cultures treated with H2O2 (200 μm) for the indicated times. C, Mitochondrial activity measured by MTT assay of WT and PK-KO glial cultures incubated with H2O2 (100 μm) for 3 h; at the time of the peroxide treatment, preestablished groups received FeSO4 (50 μm). D, Two hours before H2O2 (200 μm) treatment, preestablished groups received the iron-chelator DFO (2 and 4 mm). Values are the mean ± SEM of three independent cultures with six replicates each. Statistical analysis was performed by two-way ANOVA (the interaction between genotype and treatment was p < 0.01), followed by Bonferroni's post hoc test. +p < 0.05; ++p < 0.01, PK-KO versus WT cultures. *p < 0.05; ***p < 0.001, treated cultures versus controls. ΔΔp < 0.01; ΔΔΔp < 0.001 versus the corresponding H2O2 treatment without the inhibitors FeSO4 or DFO.
Figure 6.
Figure 6.
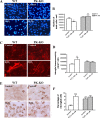
Effects of hydrogen peroxide on glial cell viability in WT and PK-KO cultures. At 6–7 d after reseeding, the cells were treated with 100 μm H2O2 for 3 h in EMEM plus d-glucose. A, LDH activity. B, Percentage of cells with the chromatin condensed or fragmented. C, Photomicrographs of TUNEL+ cells in WT and PK-KO from control and H2O2 (100 μm) treated cells. Scale bar, 30 μm. D, Percentage of TUNEL+ cells. Photomicrographs (E) and percentage of PI+ cells (F). Scale bar, 30 μm. The values express the mean ± SEM of six replicates each. Statistical analysis was performed by two-way ANOVA (the interaction between genotype and treatment was p < 0.05), followed by Bonferroni's post hoc test. ++p < 0.01; +++p < 0.001, PK-KO versus WT cultures. *p < 0.05; ***p < 0.001, H2O2 treated cultures versus controls.
Figure 7.
Figure 7.
Effects of hydrogen peroxide on glial cell phenotypes in WT and PK-KO cultures. At 6–7 d after reseeding, the cells were treated with 100 μm H2O2 for 3 h in EMEM plus d-glucose. A, Photomicrographs of total nuclei stained with bis-benzimide in WT and PK-KO from control and H2O2 (100 μm) treated cells. Scale bar, 30 μm. B, Number of total cells present in the cultures. C, Photomicrographs showing type 2 astrocytes (GFAP+) in WT and PK-KO from control and H2O2 (100 μm) treated cells. Scale bar, 30 μm. D, Astroglial immunoreactivity (GFAP+) in the cultures. Photomicrographs (E) and percentage of microglial cells (F) (isolectin B4+ cells) in WT and PK-KO from cultures treated with H2O2 (100 μm) or solvent. Scale bar, 30 μm. Values are the mean ± SEM of six replicates each. Statistical analysis was performed by two-way ANOVA (the interaction between genotype and treatment was p < 0.05), followed by Bonferroni's post hoc test. ++p < 0.01, PK-KO versus WT cultures. *p < 0.05; **p < 0.01; ***p < 0.001, H2O2-treated cultures versus controls.
Figure 8.
Figure 8.
Effects of aging on WT and PK-KO glial cultures. Glial cultures of WT and PK-KO mice were maintained in DMEM plus 15% FCS for different periods of time. A, Immunodetection and densitometric analysis of astroglial (GFAP) protein by Western blot of young (1–3 months) and aged (6–9 months) WT and PK-KO glial cultures. Percentage of microglial cells (B) (Cd11b+) and proliferating (BrdU+) (C) cells present at 1–3 and 6–9 months of culture. D, GSH levels in young and aged WT and PK-KO glial cultures. Protein expression (E) and densitometric analysis (F) of HSP-70 protein in young and aged WT and PK-KO glial cultures. Percentage of microglial cells and GSH levels are expressed as the mean ± SEM from six replicates of four and two independent cultures, respectively. Values for Western blotting experiment are the mean ± SEM from four replicates of four independent cultures. Statistical analysis was performed by two-way ANOVA (the interaction between genotype and treatment and genotype and aging were p < 0.05), followed by Bonferroni's post hoc test. +p < 0.05; ++p < 0.01; +++p < 0.001, PK-KO versus WT cultures. ***p < 0.001 old versus young cultures.
Figure 9.
Figure 9.
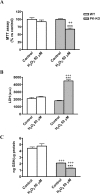
Aged PK-KO midbrain glia is more sensitive to hydrogen peroxide treatment. Glia cultures maintained for 6 months in DMEM plus 15% FCS were used for these experiments. Before H2O2 treatment, the medium of the cultures (6 d after seeding) was changed to EMEM plus glucose. Mitochondrial activity (A), LDH activity (B), and GSH levels (C) in 6-month-old WT and PK-KO cultures after treatment with H2O2 at 50 μm for 3 h. Values are the mean ± SEM of six replicates each of two independent cultures. Statistical analysis was performed by two-way ANOVA (the interaction between genotype and treatment and genotype and aging were p < 0.05), followed by Bonferroni's post hoc test. ++p < 0.01; +++p < 0.001, PK-KO versus WT cultures. ***p < 0.001, H2O2-treated cultures versus controls.
Figure 10.
Figure 10.
Effects of WT and PK-KO GCM on neuronal-enriched mesencephalic cultures from WT mice. WT neuronal-enriched midbrain cultures were treated after 6 DIV with GCM (from WT or PK-KO), defined medium (EF12), or maintained in B27/Neurobasal TM medium (control) for 24 h. A, Photomicrographs showing DA cells (TH+) in control, EF12, WT-GCM, and PK-KO-GCM treated cultures. Scale bar, 30 μm. B, Number of DA neurons expressed as TH+ cells per well. C, High-affinity [3H]DA uptake. D, Photomicrographs of total nuclei stained with bis-benzimide in control, EF12, WT-GCM, and PK-KO-GCM treated cultures. Scale bar, 30 μm. E, Chromatin condensed and fragmented nuclei were counted and expressed as a percentage of apoptotic cells with respect to the total cell number. F, Percentage of microglial cells present in the culture. Values are the mean ± SEM of three independent cultures with six replicates each. Statistical analysis was performed by one-way ANOVA, followed by Newman–Keuls multiple comparison test. +p < 0.05; ++p < 0.01; +++p < 0.001, PK-KO-GCM versus WT glia-conditioned medium. *p < 0.05; **p < 0.01; ***p < 0.001, GCM or EF12 versus controls cultures.
Figure 11.
Figure 11.
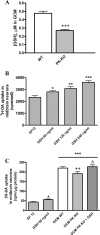
Characterization of WT and PK-KO glia-conditioned mediums. A, GSH concentration in GCM from WT or PK-KO. B, Dose-dependent GSH effects on WT midbrain neuronal cultures. C, [3H]DA uptake in WT midbrain neurons treated with PK-KO-GCM and GSH. Values are the mean ± SEM of two independent cultures with six replicates each. Statistical analysis was performed by one-way ANOVA, followed by Newman–Keuls multiple comparison test. +p < 0.05; ++p < 0.01; +++p < 0.001, PK-KO-GCM versus WT glia-conditioned medium. *p < 0.05; **p < 0.01; ***p < 0.001, GCM versus EF12 incubated cultures. Δp < 0.05 PK-KO-GCM plus GSH versus PK-KO-GCM.

Similar articles

Cited by

References

    1. Abbas N, Lucking CB, Ricard S, Durr A, Bonifati V, De Michele G, Bouley S, Vaughan JR, Gasser T, Marconi R, Broussolle E, Brefel-Courbon C, Harhangi BS, Oostra BA, Fabrizio E, Bohme GA, Pradier L, Wood NW, Filla A, Meco G, Denefle P, Agid Y, Brice A. A wide variety of mutations in the parkin gene are responsible for autosomal recessive parkinsonism in Europe. French Parkinson's Disease Genetics Study Group and the European Consortium on Genetic Susceptibility in Parkinson's Disease. Hum Mol Genet. 1999;8:567–574. - PubMed
    1. Andringa G, Bol JG, Wang X, Boekel A, Bennett MC, Chase TN, Drukarch B. Changed distribution pattern of the constitutive rather than the inducible HSP70 chaperone in neuromelanin-containing neurones of the Parkinsonian midbrain. Neuropathol Appl Neurobiol. 2006;32:157–169. - PubMed
    1. Arenas E. Stem cells in the treatment of Parkinson's disease. Brain Res Bull. 2002;57:795–808. - PubMed
    1. Ashwell K. The distribution of microglia and cell death in the fetal rat forebrain. Brain Res Dev Brain Res. 1991;58:1–12. - PubMed
    1. Barker JE, Heales SJ, Cassidy A, Bolanos JP, Land JM, Clark JB. Depletion of brain glutathione results in a decrease of glutathione reductase activity; an enzyme susceptible to oxidative damage. Brain Res. 1996;716:118–122. - PubMed

Publication types

MeSH terms