

Transcriptional networks inferred from molecular signatures of breast cancer
- PMID: 18187569
- PMCID: PMC2312359
- DOI: 10.2353/ajpath.2008.061079
Transcriptional networks inferred from molecular signatures of breast cancer
Abstract
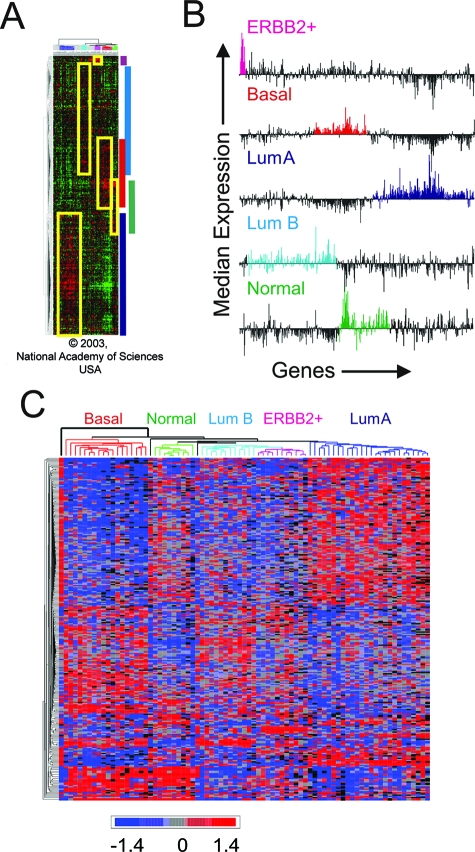
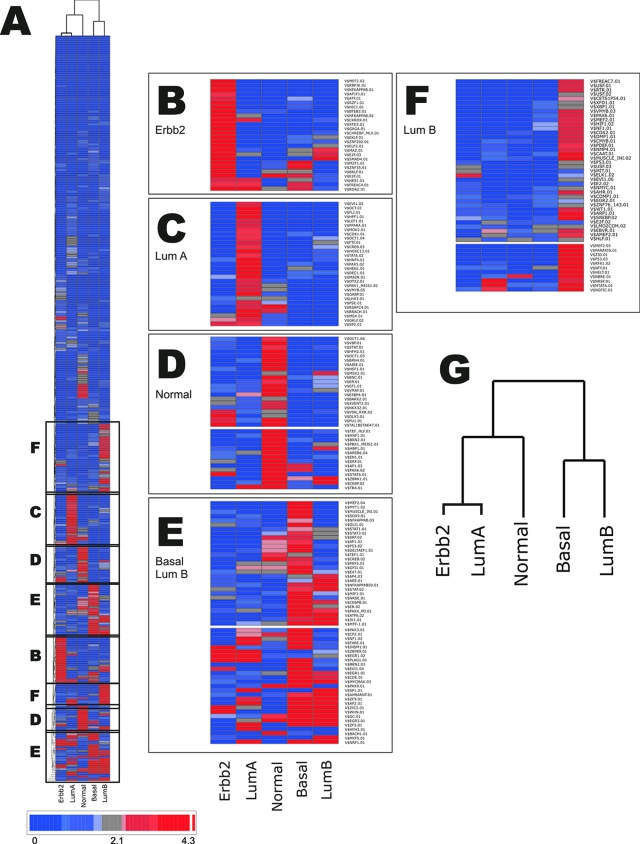
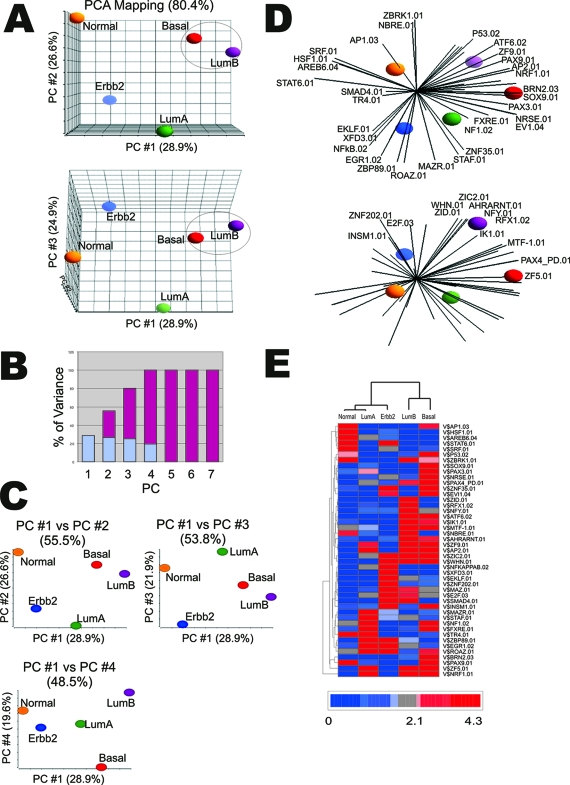
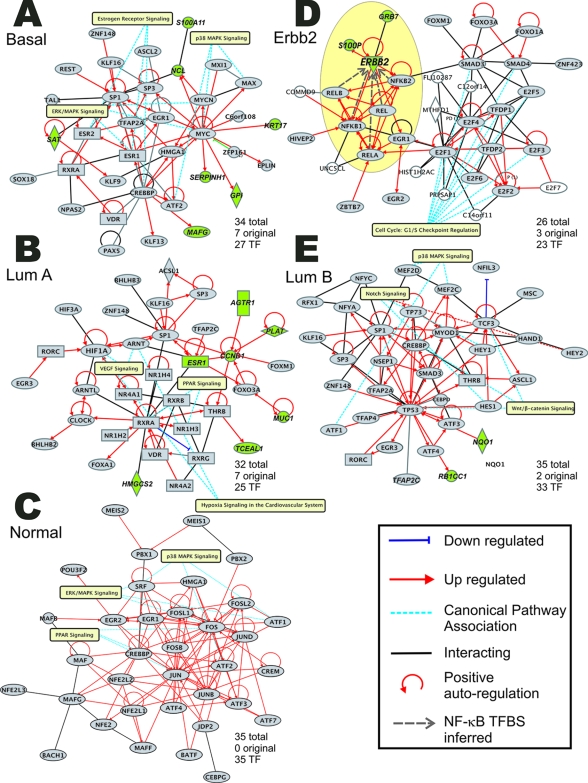
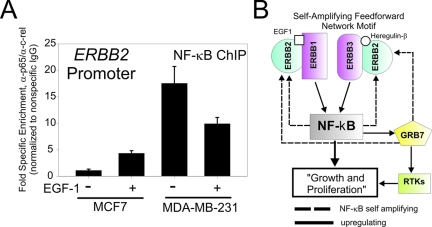
Global genomic approaches in cancer research have provided new and innovative strategies for the identification of signatures that differentiate various types of human cancers. Computational analysis of the promoter composition of the genes within these signatures may provide a powerful method for deducing the regulatory transcriptional networks that mediate their collective function. In this study we have systematically analyzed the promoter composition of gene classes derived from previously established genetic signatures that recently have been shown to reliably and reproducibly distinguish five molecular subtypes of breast cancer associated with distinct clinical outcomes. Inferences made from the trends of transcription factor binding site enrichment in the promoters of these gene groups led to the identification of regulatory pathways that implicate discrete transcriptional networks associated with specific molecular subtypes of breast cancer. One of these inferred pathways predicted a role for nuclear factor-kappaB in a novel feed-forward, self-amplifying, autoregulatory module regulated by the ERBB family of growth factor receptors. The existence of this pathway was verified in vivo by chromatin immunoprecipitation and shown to be deregulated in breast cancer cells overexpressing ERBB2. This analysis indicates that approaches of this type can provide unique insights into the differential regulatory molecular programs associated with breast cancer and will aid in identifying specific transcriptional networks and pathways as potential targets for tumor subtype-specific therapeutic intervention.
Figures
Similar articles
-
Distal ERBB2 promoter fragment displays specific transcriptional and nuclear binding activities in ERBB2 overexpressing breast cancer cells.DNA Cell Biol. 2005 Sep;24(9):582-94. doi: 10.1089/dna.2005.24.582. DNA Cell Biol. 2005. PMID: 16153159
-
Comprehensive annotation of bidirectional promoters identifies co-regulation among breast and ovarian cancer genes.PLoS Comput Biol. 2007 Apr 20;3(4):e72. doi: 10.1371/journal.pcbi.0030072. Epub 2007 Mar 5. PLoS Comput Biol. 2007. PMID: 17447839 Free PMC article.
-
A negative feedback regulatory loop associates the tyrosine kinase receptor ERBB2 and the transcription factor GATA4 in breast cancer cells.Mol Cancer Res. 2009 Mar;7(3):402-14. doi: 10.1158/1541-7786.MCR-08-0175. Epub 2009 Mar 10. Mol Cancer Res. 2009. PMID: 19276186
-
Trastuzumab and beyond: sequencing cancer genomes and predicting molecular networks.Pharmacogenomics J. 2011 Apr;11(2):81-92. doi: 10.1038/tpj.2010.81. Epub 2010 Oct 26. Pharmacogenomics J. 2011. PMID: 20975737 Review.
-
Positive and negative transcriptional regulation of aromatase expression in human breast cancer tissue.J Steroid Biochem Mol Biol. 2005 May;95(1-5):17-23. doi: 10.1016/j.jsbmb.2005.04.002. J Steroid Biochem Mol Biol. 2005. PMID: 15955695 Review.
Cited by
-
Integrative microRNA and proteomic approaches identify novel osteoarthritis genes and their collaborative metabolic and inflammatory networks.PLoS One. 2008;3(11):e3740. doi: 10.1371/journal.pone.0003740. Epub 2008 Nov 17. PLoS One. 2008. PMID: 19011694 Free PMC article.
-
Systematic identification of transcription factors associated with patient survival in cancers.BMC Genomics. 2009 May 15;10:225. doi: 10.1186/1471-2164-10-225. BMC Genomics. 2009. PMID: 19442316 Free PMC article.
-
Divide and conquer: the genetic basis of molecular subclassification of breast cancer.EMBO Mol Med. 2011 Apr;3(4):183-5. doi: 10.1002/emmm.201100128. Epub 2011 Mar 10. EMBO Mol Med. 2011. PMID: 21394915 Free PMC article.
-
Overrepresentation of transcription factor families in the genesets underlying breast cancer subtypes.BMC Genomics. 2012 May 22;13:199. doi: 10.1186/1471-2164-13-199. BMC Genomics. 2012. PMID: 22616941 Free PMC article.
-
Interplay between NRF1, E2F4 and MYC transcription factors regulating common target genes contributes to cancer development and progression.Cell Oncol (Dordr). 2018 Oct;41(5):465-484. doi: 10.1007/s13402-018-0395-3. Epub 2018 Jul 25. Cell Oncol (Dordr). 2018. PMID: 30047092 Review.
References
-
- Golub TR, Slonim DK, Tamayo P, Huard C, Gaasenbeek M, Mesirov JP, Coller H, Loh ML, Downing JR, Caligiuri MA, Bloomfield CD, Lander ES. Molecular classification of cancer: class discovery and class prediction by gene expression monitoring. Science. 1999;286:531–537. - PubMed
-
- Sorlie T, Tibshirani R, Parker J, Hastie T, Marron JS, Nobel A, Deng S, Johnsen H, Pesich R, Geisler S, Demeter J, Perou CM, Lonning PE, Brown PO, Borresen-Dale AL, Botstein D. Repeated observation of breast tumor subtypes in independent gene expression data sets. Proc Natl Acad Sci USA. 2003;100:8418–8423. - PMC - PubMed
-
- Sørlie T, Perou CM, Tibshirani R, Aas T, Geisler S, Johnsen H, Hastie T, Eisen MB, van de RM, Jeffrey SS, Thorsen T, Quist H, Matese JC, Brown PO, Botstein D, Eystein LP, Borresen-Dale AL. Gene expression patterns of breast carcinomas distinguish tumor subclasses with clinical implications. Proc Natl Acad Sci USA. 2001;98:10869–10874. - PMC - PubMed
-
- Perou CM, Sorlie T, Eisen MB, van de RM, Jeffrey SS, Rees CA, Pollack JR, Ross DT, Johnsen H, Akslen LA, Fluge O, Pergamenschikov A, Williams C, Zhu SX, Lonning PE, Borresen-Dale AL, Brown PO, Botstein D. Molecular portraits of human breast tumours. Nature. 2000;406:747–752. - PubMed
-
- Rhodes DR, Yu J, Shanker K, Deshpande N, Varambally R, Ghosh D, Barrette T, Pandey A, Chinnaiyan AM. Large-scale meta-analysis of cancer microarray data identifies common transcriptional profiles of neoplastic transformation and progression. Proc Natl Acad Sci USA. 2004;101:9309–9314. - PMC - PubMed
Publication types
MeSH terms
Substances
Grants and funding
LinkOut - more resources
Full Text Sources
Medical
Research Materials
Miscellaneous
