Metabolic pathway profiling of mitochondrial respiratory chain mutants in C. elegans
- PMID: 18178500
- PMCID: PMC2424222
- DOI: 10.1016/j.ymgme.2007.11.007
Metabolic pathway profiling of mitochondrial respiratory chain mutants in C. elegans
Abstract
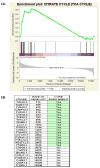
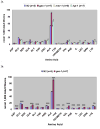
Caenorhabditis elegans affords a model of primary mitochondrial dysfunction that provides insight into cellular adaptations which accompany mutations in nuclear genes that encode mitochondrial proteins. To this end, we characterized genome-wide expression profiles of C. elegans strains with mutations in nuclear-encoded subunits of respiratory chain complexes. Our goal was to detect concordant changes among clusters of genes that comprise defined metabolic pathways. Results indicate that respiratory chain mutants significantly upregulate a variety of basic cellular metabolic pathways involved in carbohydrate, amino acid, and fatty acid metabolism, as well as cellular defense pathways such as the metabolism of P450 and glutathione. To further confirm and extend expression analysis findings, quantitation of whole worm free amino acid levels was performed in C. elegans mitochondrial mutants for subunits of complexes I, II, and III. Significant differences were seen for 13 of 16 amino acid levels in complex I mutants compared with controls, as well as overarching similarities among profiles of complex I, II, and III mutants compared with controls. The specific pattern of amino acid alterations observed provides novel evidence to suggest that an increase in glutamate-linked transamination reactions caused by the failure of NAD(+)-dependent ketoacid oxidation occurs in primary mitochondrial respiratory chain mutants. Recognition of consistent alterations both among patterns of nuclear gene expression for multiple biochemical pathways and in quantitative amino acid profiles in a translational genetic model of mitochondrial dysfunction allows insight into the complex pathogenesis underlying primary mitochondrial disease. Such knowledge may enable the development of a metabolomic profiling diagnostic tool applicable to human mitochondrial disease.
Figures


Similar articles
-
Comparison of proteomic and metabolomic profiles of mutants of the mitochondrial respiratory chain in Caenorhabditis elegans.Mitochondrion. 2015 Jan;20:95-102. doi: 10.1016/j.mito.2014.12.004. Epub 2014 Dec 19. Mitochondrion. 2015. PMID: 25530493 Free PMC article.
-
In vivo metabolic flux profiling with stable isotopes discriminates sites and quantifies effects of mitochondrial dysfunction in C. elegans.Mol Genet Metab. 2014 Mar;111(3):331-341. doi: 10.1016/j.ymgme.2013.12.011. Epub 2013 Dec 27. Mol Genet Metab. 2014. PMID: 24445252 Free PMC article.
-
Mutations in the Caenorhabditis elegans orthologs of human genes required for mitochondrial tRNA modification cause similar electron transport chain defects but different nuclear responses.PLoS Genet. 2017 Jul 21;13(7):e1006921. doi: 10.1371/journal.pgen.1006921. eCollection 2017 Jul. PLoS Genet. 2017. PMID: 28732077 Free PMC article.
-
Effects of the mitochondrial respiratory chain on longevity in C. elegans.Exp Gerontol. 2014 Aug;56:245-55. doi: 10.1016/j.exger.2014.03.028. Epub 2014 Apr 5. Exp Gerontol. 2014. PMID: 24709342 Review.
-
Phenotypic dichotomy in mitochondrial complex II genetic disorders.J Mol Med (Berl). 2001 Sep;79(9):495-503. doi: 10.1007/s001090100267. J Mol Med (Berl). 2001. PMID: 11692162 Review.
Cited by
-
VRK-1 extends life span by activation of AMPK via phosphorylation.Sci Adv. 2020 Jul 1;6(27):eaaw7824. doi: 10.1126/sciadv.aaw7824. Print 2020 Jul. Sci Adv. 2020. PMID: 32937443 Free PMC article.
-
A regulated response to impaired respiration slows behavioral rates and increases lifespan in Caenorhabditis elegans.PLoS Genet. 2009 Apr;5(4):e1000450. doi: 10.1371/journal.pgen.1000450. Epub 2009 Apr 10. PLoS Genet. 2009. PMID: 19360127 Free PMC article.
-
Bacteria, yeast, worms, and flies: exploiting simple model organisms to investigate human mitochondrial diseases.Dev Disabil Res Rev. 2010;16(2):200-18. doi: 10.1002/ddrr.114. Dev Disabil Res Rev. 2010. PMID: 20818735 Free PMC article. Review.
-
Genome-wide RNAi Screen for Fat Regulatory Genes in C. elegans Identifies a Proteostasis-AMPK Axis Critical for Starvation Survival.Cell Rep. 2017 Jul 18;20(3):627-640. doi: 10.1016/j.celrep.2017.06.068. Cell Rep. 2017. PMID: 28723566 Free PMC article.
-
Comparison of proteomic and metabolomic profiles of mutants of the mitochondrial respiratory chain in Caenorhabditis elegans.Mitochondrion. 2015 Jan;20:95-102. doi: 10.1016/j.mito.2014.12.004. Epub 2014 Dec 19. Mitochondrion. 2015. PMID: 25530493 Free PMC article.
References
-
- Haas RH, et al. Mitochondrial Disease: A practical approach for primary care physicians. Pediatrics. 2007 in press. - PubMed
-
- Schaefer AM, et al. The epidemiology of mitochondrial disorders--past, present and future. Biochim Biophys Acta. 2004;1659(2–3):115–20. - PubMed
-
- Thorburn DR, et al. Biochemical and molecular diagnosis of mitochondrial respiratory chain disorders. Biochim Biophys Acta. 2004;1659(2–3):121–8. - PubMed
-
- Wolf NI, Smeitink JA. Mitochondrial disorders: a proposal for consensus diagnostic criteria in infants and children. Neurology. 2002;59(9):1402–5. - PubMed
-
- WormBase web site. [accessed 11–1–07]. http://www.wormbase.org, release WS182.
Publication types
MeSH terms
Substances
Grants and funding
- M01 RR000240-390425/RR/NCRR NIH HHS/United States
- R01 GM058881/GM/NIGMS NIH HHS/United States
- K08-DK073545/DK/NIDDK NIH HHS/United States
- P30 HD026979/HD/NICHD NIH HHS/United States
- K08 DK073545-03/DK/NIDDK NIH HHS/United States
- K08 DK073545/DK/NIDDK NIH HHS/United States
- R01-GM58881/GM/NIGMS NIH HHS/United States
- K08 DK073545-02/DK/NIDDK NIH HHS/United States
- P01 NS054900-020002/NS/NINDS NIH HHS/United States
- P01 NS054900/NS/NINDS NIH HHS/United States
- P30 HD026979-20/HD/NICHD NIH HHS/United States
- R01 GM058881-04/GM/NIGMS NIH HHS/United States
- M01 RR000240/RR/NCRR NIH HHS/United States
- M01 RR000240-410425/RR/NCRR NIH HHS/United States
LinkOut - more resources
Full Text Sources
Medical
Molecular Biology Databases

