

High levels of MeCP2 depress MHC class I expression in neuronal cells
- PMID: 18159237
- PMCID: PMC2131781
- DOI: 10.1371/journal.pone.0001354
High levels of MeCP2 depress MHC class I expression in neuronal cells
Abstract
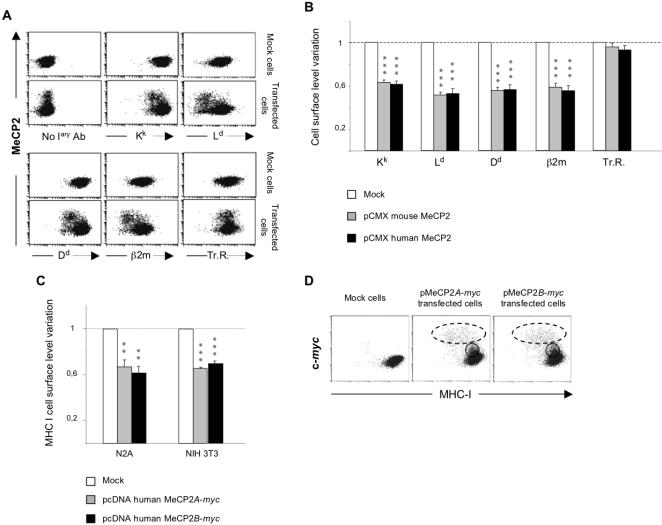
Background: The expression of MHC class I genes is repressed in mature neurons. The molecular basis of this regulation is poorly understood, but the genes are particularly rich in CpG islands. MeCP2 is a transcriptional repressor that binds to methylated CpG dinucleotides; mutations in this protein also cause the neurodevelopmental disease called Rett syndrome. Because MHC class I molecules play a role in neuronal connectivity, we hypothesised that MeCP2 might repress MHC class I expression in the CNS and that this might play a role in the pathology of Rett syndrome.
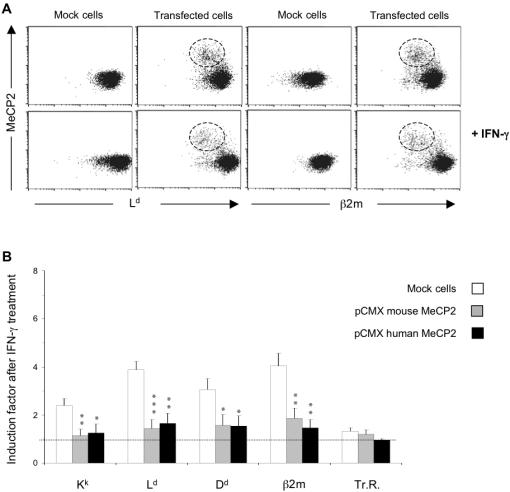
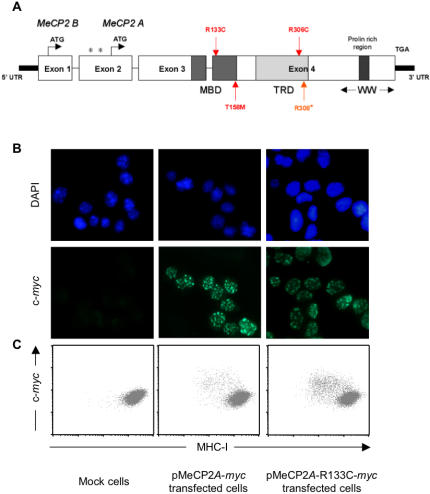
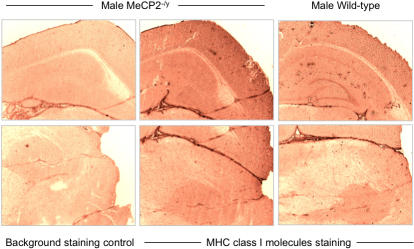
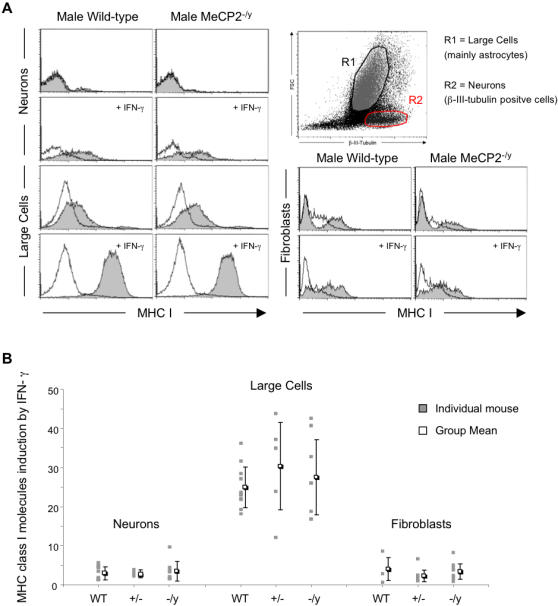
Methodology: We show here that transiently transfected cells expressing high levels of MeCP2 specifically downregulate cell-surface expression of MHC class I molecules in the neuronal cell line N2A and they prevent the induction of MHC class I expression in response to interferon in these cells, supporting our first hypothesis. Surprisingly, however, overexpression of the mutated forms of MeCP2 that cause Rett syndrome had a similar effect on MHC class I expression as the wild-type protein. Immunohistological analyses of brain slices from MECP2 knockout mice (the MeCP2(tm1.1Bird) strain) demonstrated a small but reproducible increase in MHC class I when compared to their wild type littermates, but we found no difference in MHC class I expression in primary cultures of mixed glial cells (mainly neurons and astrocytes) from the knockout and wild-type mice.
Conclusion: These data suggest that high levels of MeCP2, such as those found in mature neurons, may contribute to the repression of MHC expression, but we find no evidence that MeCP2 regulation of MHC class I is important for the pathogenesis of Rett syndrome.
Conflict of interest statement
Figures
Similar articles
-
DNA methylation in the gene body influences MeCP2-mediated gene repression.Proc Natl Acad Sci U S A. 2016 Dec 27;113(52):15114-15119. doi: 10.1073/pnas.1618737114. Epub 2016 Dec 13. Proc Natl Acad Sci U S A. 2016. PMID: 27965390 Free PMC article.
-
Disruption of DNA-methylation-dependent long gene repression in Rett syndrome.Nature. 2015 Jun 4;522(7554):89-93. doi: 10.1038/nature14319. Epub 2015 Mar 11. Nature. 2015. PMID: 25762136 Free PMC article.
-
Differential Expression and Regulation of Brain-Derived Neurotrophic Factor (BDNF) mRNA Isoforms in Brain Cells from Mecp2(308/y) Mouse Model.J Mol Neurosci. 2015 Aug;56(4):758-767. doi: 10.1007/s12031-014-0487-0. Epub 2015 Jan 30. J Mol Neurosci. 2015. PMID: 25634725
-
MeCP2 in central nervous system glial cells: current updates.Acta Neurobiol Exp (Wars). 2018;78(1):30-40. Acta Neurobiol Exp (Wars). 2018. PMID: 29694339 Review.
-
MeCP2 dysfunction in Rett syndrome and related disorders.Curr Opin Genet Dev. 2006 Jun;16(3):276-81. doi: 10.1016/j.gde.2006.04.009. Epub 2006 May 2. Curr Opin Genet Dev. 2006. PMID: 16647848 Review.
Cited by
-
Characterization of signaling function and expression of HLA class I molecules in medulloblastoma.J Neurooncol. 2011 Jun;103(2):197-206. doi: 10.1007/s11060-010-0378-3. Epub 2010 Sep 2. J Neurooncol. 2011. PMID: 20811766 Free PMC article.
-
MHC class I immune proteins are critical for hippocampus-dependent memory and gate NMDAR-dependent hippocampal long-term depression.Learn Mem. 2013 Sep 1;20(9):505-17. doi: 10.1101/lm.031351.113. Learn Mem. 2013. PMID: 23959708 Free PMC article.
-
Japanese encephalitis virus induce immuno-competency in neural stem/progenitor cells.PLoS One. 2009 Dec 2;4(12):e8134. doi: 10.1371/journal.pone.0008134. PLoS One. 2009. PMID: 19956550 Free PMC article.
-
Neuronal MHC Class I Expression Is Regulated by Activity Driven Calcium Signaling.PLoS One. 2015 Aug 11;10(8):e0135223. doi: 10.1371/journal.pone.0135223. eCollection 2015. PLoS One. 2015. PMID: 26263390 Free PMC article.
-
MHC class I: an unexpected role in neuronal plasticity.Neuron. 2009 Oct 15;64(1):40-5. doi: 10.1016/j.neuron.2009.09.044. Neuron. 2009. PMID: 19840547 Free PMC article.
References
-
- Amir RE, Van den Veyver IB, Wan M, Tran CQ, Francke U, et al. Rett syndrome is caused by mutations in X-linked MECP2, encoding methyl-CpG-binding protein 2. Nat Genet. 1999;23:185–188. - PubMed
-
- Bienvenu T, Carrie A, de Roux N, Vinet MC, Jonveaux P, et al. MECP2 mutations account for most cases of typical forms of Rett syndrome. Hum Mol Genet. 2000;9:1377–1384. - PubMed
-
- Percy AK. Rett syndrome. Current status and new vistas. Neurol Clin. 2002;20:1125–1141. - PubMed
-
- Hagberg B, Aicardi J, Dias K, Ramos O. A progressive syndrome of autism, dementia, ataxia, and loss of purposeful hand use in girls: Rett's syndrome: report of 35 cases. Ann Neurol. 1983;14:471–479. - PubMed
Publication types
MeSH terms
Substances
LinkOut - more resources
Full Text Sources
Molecular Biology Databases
Research Materials
