Interleukin-17 production in central nervous system-infiltrating T cells and glial cells is associated with active disease in multiple sclerosis
- PMID: 18156204
- PMCID: PMC2189615
- DOI: 10.2353/ajpath.2008.070690
Interleukin-17 production in central nervous system-infiltrating T cells and glial cells is associated with active disease in multiple sclerosis
Abstract
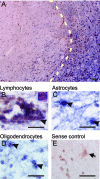
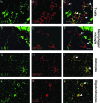
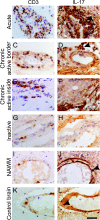
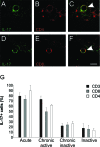
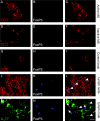
Recent findings in the animal model for multiple sclerosis (MS), experimental autoimmune encephalomyelitis, implicate a novel CD4+ T-cell subset (TH17), characterized by the secretion of interleukin-17 (IL-17), in disease pathogenesis. To elucidate its role in MS, brain tissues from patients with MS were compared to controls. We detected expression of IL-17 mRNA (by in situ hybridization) and protein (by immunohistochemistry) in perivascular lymphocytes as well as in astrocytes and oligodendrocytes located in the active areas of MS lesions. Further, we found a significant increase in the number of IL-17+ T cells in active rather than inactive areas of MS lesions. Specifically, double immunofluorescence showed that IL-17 immunoreactivity was detected in 79% of T cells in acute lesions, 73% in active areas of chronic active lesions, but in only 17% of those in inactive lesions and 7% in lymph node control tissue. CD8+, as well as CD4+, T cells were equally immunostained for IL-17 in MS tissues. Interestingly, and in contrast to lymph node T cells, no perivascular T cells showed FoxP3 expression, a marker of regulatory T cells, at any stage of MS lesions. These observations suggest an enrichment of both IL-17+CD4+ and CD8+ T cells in active MS lesions as well as an important role for IL-17 in MS pathogenesis, with some remarkable differences from the experimental autoimmune encephalomyelitis model.
Figures

Comment in
-
Interleukin-17--extended features of a key player in multiple sclerosis.Am J Pathol. 2008 Jan;172(1):8-10. doi: 10.2353/ajpath.2008.070862. Epub 2007 Dec 6. Am J Pathol. 2008. PMID: 18063700 Free PMC article. No abstract available.
Similar articles
-
IL-21 and IL-21 receptor expression in lymphocytes and neurons in multiple sclerosis brain.Am J Pathol. 2011 Feb;178(2):794-802. doi: 10.1016/j.ajpath.2010.10.043. Am J Pathol. 2011. PMID: 21281812 Free PMC article.
-
T cells in multiple sclerosis and experimental autoimmune encephalomyelitis.Clin Exp Immunol. 2010 Oct;162(1):1-11. doi: 10.1111/j.1365-2249.2010.04143.x. Clin Exp Immunol. 2010. PMID: 20682002 Free PMC article. Review.
-
IL-17A and Multiple Sclerosis: Signaling Pathways, Producing Cells and Target Cells in the Central Nervous System.Curr Drug Targets. 2016;17(16):1882-1893. doi: 10.2174/1389450117666160307144027. Curr Drug Targets. 2016. PMID: 26953244 Review.
-
Cellular localization and expression patterns of interleukin-10, interleukin-4, and their receptors in multiple sclerosis lesions.Glia. 2002 Apr 1;38(1):24-35. doi: 10.1002/glia.10050. Glia. 2002. PMID: 11921201
-
Contribution of astrocyte-derived IL-15 to CD8 T cell effector functions in multiple sclerosis.J Immunol. 2010 Nov 15;185(10):5693-703. doi: 10.4049/jimmunol.1002188. Epub 2010 Oct 6. J Immunol. 2010. PMID: 20926794
Cited by
-
Lymphocytes with cytotoxic activity induce rapid microtubule axonal destabilization independently and before signs of neuronal death.ASN Neuro. 2013 Feb 6;5(1):e00105. doi: 10.1042/AN20120087. ASN Neuro. 2013. PMID: 23289514 Free PMC article.
-
Differential Gene Expression Patterns in Blood and Cerebrospinal Fluid of Multiple Sclerosis and Neuro-Behçet Disease.Front Genet. 2021 Feb 26;12:638236. doi: 10.3389/fgene.2021.638236. eCollection 2021. Front Genet. 2021. PMID: 33719347 Free PMC article.
-
Pericytes regulate vascular immune homeostasis in the CNS.Proc Natl Acad Sci U S A. 2021 Mar 9;118(10):e2016587118. doi: 10.1073/pnas.2016587118. Proc Natl Acad Sci U S A. 2021. PMID: 33653955 Free PMC article.
-
Frequency of circulating topoisomerase-I-specific CD4 T cells predicts presence and progression of interstitial lung disease in scleroderma.Arthritis Res Ther. 2016 May 4;18(1):99. doi: 10.1186/s13075-016-0993-2. Arthritis Res Ther. 2016. PMID: 27145754 Free PMC article.
-
Tanshinone IIA attenuates experimental autoimmune encephalomyelitis in rats.Mol Med Rep. 2016 Aug;14(2):1601-9. doi: 10.3892/mmr.2016.5431. Epub 2016 Jun 23. Mol Med Rep. 2016. PMID: 27357729 Free PMC article.
References
-
- Sospedra M, Martin R. Immunology of multiple sclerosis. Annu Rev Immunol. 2005;23:683–747. - PubMed
-
- Zamvil SS, Steinman L. The T lymphocyte in experimental allergic encephalomyelitis. Annu Rev Immunol. 1990;8:579–621. - PubMed
-
- Zheng Y, Danilenko DM, Valdez P, Kasman I, Eastham-Anderson J, Wu J, Ouyang W. Interleukin-22, a T(H)17 cytokine, mediates IL-23-induced dermal inflammation and acanthosis. Nature. 2007;445:648–651. - PubMed
-
- Laurence A, Tato CM, Davidson TS, Kanno Y, Chen Z, Yao Z, Blank RB, Meylan F, Siegel R, Hennighausen L, Shevach EM, O’Shea JJ. Interleukin-2 signaling via STAT5 constrains T helper 17 cell generation. Immunity. 2007;26:371–381. - PubMed
Publication types
MeSH terms
Substances
Grants and funding
LinkOut - more resources
Full Text Sources
Other Literature Sources
Medical
Research Materials

