Review
. 2008 Jan;8(1):9-21.
doi: 10.1038/nri2232.

Launching the T-cell-lineage developmental programme

Affiliations
Review

Launching the T-cell-lineage developmental programme

Ellen V Rothenberg et al. Nat Rev Immunol. 2008 Jan.

Abstract

Multipotent blood progenitor cells enter the thymus and begin a protracted differentiation process in which they gradually acquire T-cell characteristics while shedding their legacy of developmental plasticity. Notch signalling and basic helix-loop-helix E-protein transcription factors collaborate repeatedly to trigger and sustain this process throughout the period leading up to T-cell lineage commitment. Nevertheless, the process is discontinuous with separately regulated steps that demand roles for additional collaborating factors. This Review discusses new evidence on the coordination of specification and commitment in the early T-cell pathway; effects of microenvironmental signals; the inheritance of stem-cell regulatory factors; and the ensemble of transcription factors that modulate the effects of Notch and E proteins, to distinguish individual stages and to polarize T-cell-lineage fate determination.


Figures

Figure 1
Figure 1. Stages in early T-cell development
Top panel: Path of T-cell precursors through the thymus during development. A major pathway for adult murine thymocyte development is depicted, with cells shown from the point of entry into the thymus at the cortico–medullary junction through their migration to the outer rim of the cortex during the progression toward commitment, on the left-hand path. Early T-cell precursors (ETP), double negative (DN) 2 subsets, DN3 subsets, and DN4 cells are defined as described in Table 1. In the adult thymus, the immigrants initially enter the thymus through vessels near the cortical-medullary junction, and migrate outward through the thymus as shown as they pass through the indicated stages. Note that at any given cell cycle, the ETPs appear to have the options either to continue their expansion, with minimal differentiation, in the cortical-medullary junction region or to differentiate into DN2 cells (presumably, DN2a cells as shown) and begin their migration outward through the cortex. For β-selection, they are situated in the extreme outer portion of the thymus (subscapsular zone). The reversal of migration for later stages of thymocyte development is shown on the right-hand path. Broken arrows depict alternative developmental pathways that are still open to ETP and different subsets of DN2 cells that are likely to correspond to DN2a and DN2b cells.
Figure 2
Figure 2. Expression levels of differentiation and regulatory genes in early T-cell development
A comprehensive set of expression patterns is shown for 39 differentiation and regulatory genes in subsets of adult murine thymocytes. To summarize expression patterns of these genes for valid inter-gene comparisons, quantitative real-time RT-PCR results are collected here from a fixed set of 2–4 biological replicates of each of the populations indicated. All measurements were carried out as previously described,,,,,,,,, and similar results are reported by others,,,. The amounts of mRNA expressed are normalized to β-actin at each developmental stage and the values depicted as “heat maps”, using a color code to indicate relative levels on a logarithmic scale as previously described. Although small differences in gene expression levels can be meaningful, this method provides the dynamic range to depict changes of both smaller and larger magnitude. Briefly, the central value (“mid”) for each gene is the geometric mean of the maximum and minimum expression levels for that gene in the sample series, and the threefold range around this value is coded green. In (a) and (b), the mid value is for all cell subsets shown; in (c) it is the mid value for ETP, DN2a, DN2b, and DN3 cells only. The overall range of expression is then separated into discontinuous “bins” in which each shade redder represents a 3-fold increase in mRNA, while each shade bluer represents a 3-fold decrease. This analysis permits comparison between patterns of expression but does not indicate absolute RNA accumulations: poorly-expressed genes can give variability in the lower range as the central value itself is close to the detection threshold. Red stars indicate an essential member of the regulatory “core group”. Orange stars indicate partially redundant members of the “core group”. Blue stars mark PU.1, an early core group member that later switches to become an antagonist of T-cell development.
Figure 3
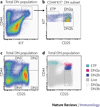
Figure 3. Phenotypic markers for the transitions through specification and commitment
Left hand panels: flow cytometric profiles of CD4CD8 double negative (DN) thymocytes from adult mice, gated for viability and absence of mature-cell lineage markers, using CD44 and c-KIT (top panel) and CD44 and CD25 (lower panel). Conventional DN1, DN2, DN3, and DN4 quadrants are marked on the lower left plot. Upper right: profiles of c-KIT and CD25 expression in CD44+c-KIT+ DN thymocytes, distinguishing Early T-cell Precursors (ETP), DN2a, and DN2b subsets. Lower right panel: location of the ETP, DN2a, DN2b, and DN3 cells within the CD44 and CD25 expression distribution of the whole DN population.
Figure 4
Figure 4. Genetic evidence for temporal roles of regulatory factors in early T-cell development
The figure summarizes times in early T-cell development when the indicated genes are essential. Data are from germline and conditional knockout studies, with additional details from in vitro differentiation assays,,,–,,,,–. Note the repeated inputs from Notch signalling and E proteins at successive stages, and the importance of MYB, RUNX--CBFβ, and GATA3 both in the earliest stages and in the functions of double negative (DN)3 cells. DN2 stages have not yet been subdivided into DN2a and DN2b in any of the literature used as sources, so this distinction has not been included. Blue text and arrows: factors promoting T-cell differentiation at a particular transition (the order of arrows shown at any one transition does not necessarily indicate the order of transcription factor activity). Purple text: factors promoting alternatives to T-cell development. Panel (a): stages from haematopoietic stem cell (HSC) to the ETP-DN2 choice point. The stages at which cells become primed to respond to Notch signals by undergoing T-lineage specification are shown. Evidence for a possible early role of E protein is noted but its timing is uncertain. Prec. = any relevant prethymic precursor population (not specifically defined). Diamond: a choice point, discussed in the text, at which ETP cells may undergo further self-renewal or else proceed to the DN2 stages; however, both choices can enhance T-cell development although with different kinetics. Panel (b): recursive roles of E proteins and Notch/Delta (Notch/DL) signalling at stages from the ETP stage through β-selection. Developmental options still open at the DN2 stage(s), and the potential reversal of the DN2 to DN3 transition, are alternatives shown by broken arrows. The broken gray line depicts the β-selection checkpoint, that is the boundary between TCR-independent developmental stages on the left and the later TCR-dependent developmental stages in the shaded zone on the right. The later developmental changes from DN4 to ISP (immature single positive) to DP are not shown as discrete transitions. Below scheme: grey triangles show approximate timing of major increases (upward-pointing) or decreases (downward-pointing) in the expression of other indicated transcription factor genes (cf. Fig. 2) as discussed in the text.

Similar articles

Cited by

References

    1. Hayday AC, Pennington DJ. Key factors in the organized chaos of early T cell development. Nature Immunol. 2007;8:137–144. - PubMed
    1. Anderson MK. At the crossroads: diverse roles of early thymocyte transcriptional regulators. Immunol. Rev. 2006;209:191–211. - PubMed
    1. Petrie HT. Cell migration and the control of post-natal T-cell lymphopoiesis in the thymus. Nature Rev. Immunol. 2003;3:859–866. - PubMed
    1. Rothenberg EV. Stepwise specification of lymphocyte developmental lineages. Curr. Opin. Genet. Dev. 2000;10:370–379. - PubMed
    1. Shortman K, et al. The linkage between T-cell and dendritic cell development in the mouse thymus. Immunol. Rev. 1998;165:39–46. - PubMed

Publication types