

Sparse optical microstimulation in barrel cortex drives learned behaviour in freely moving mice
- PMID: 18094685
- PMCID: PMC3425380
- DOI: 10.1038/nature06445
Sparse optical microstimulation in barrel cortex drives learned behaviour in freely moving mice
Abstract
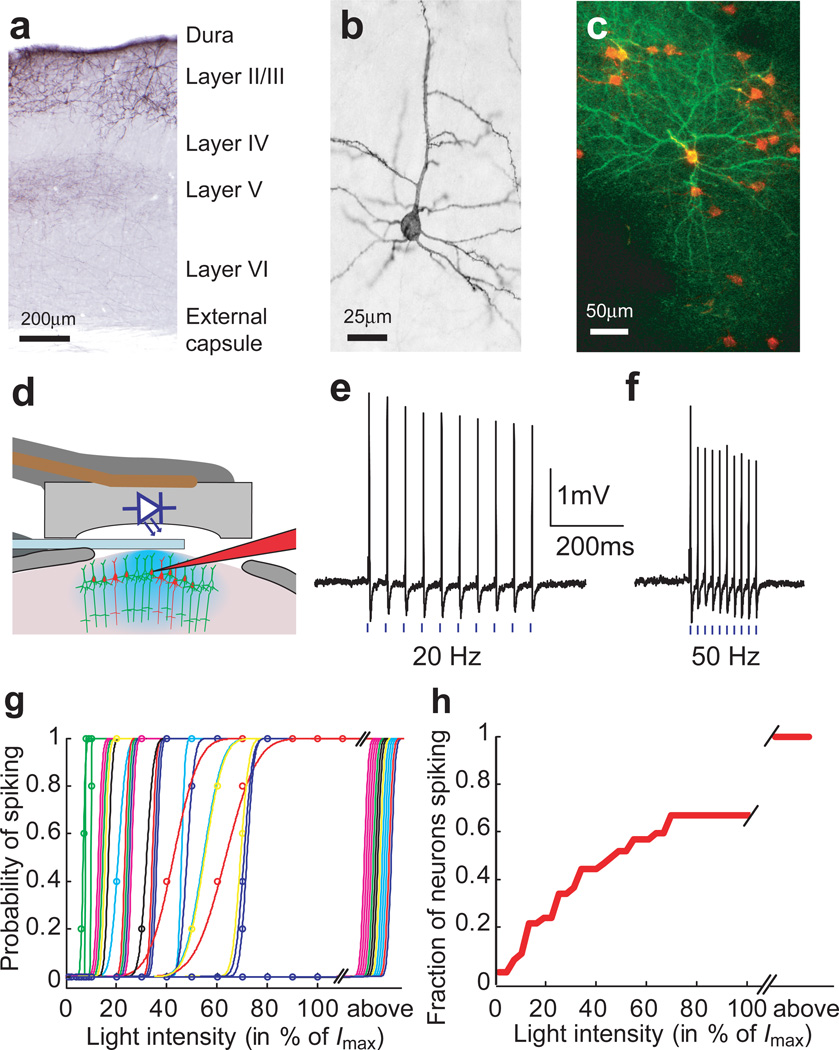
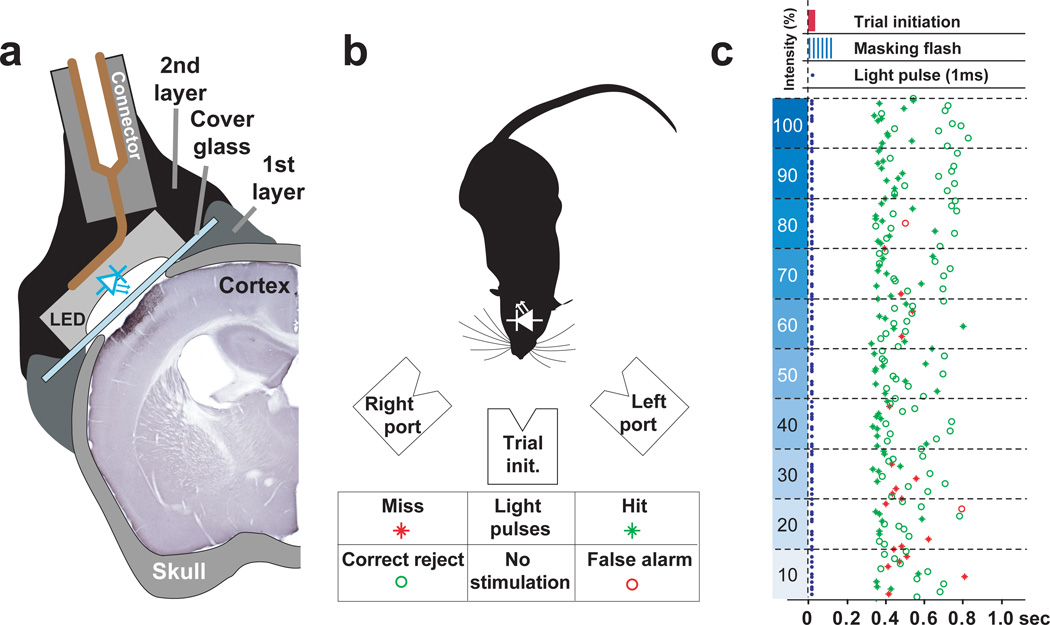
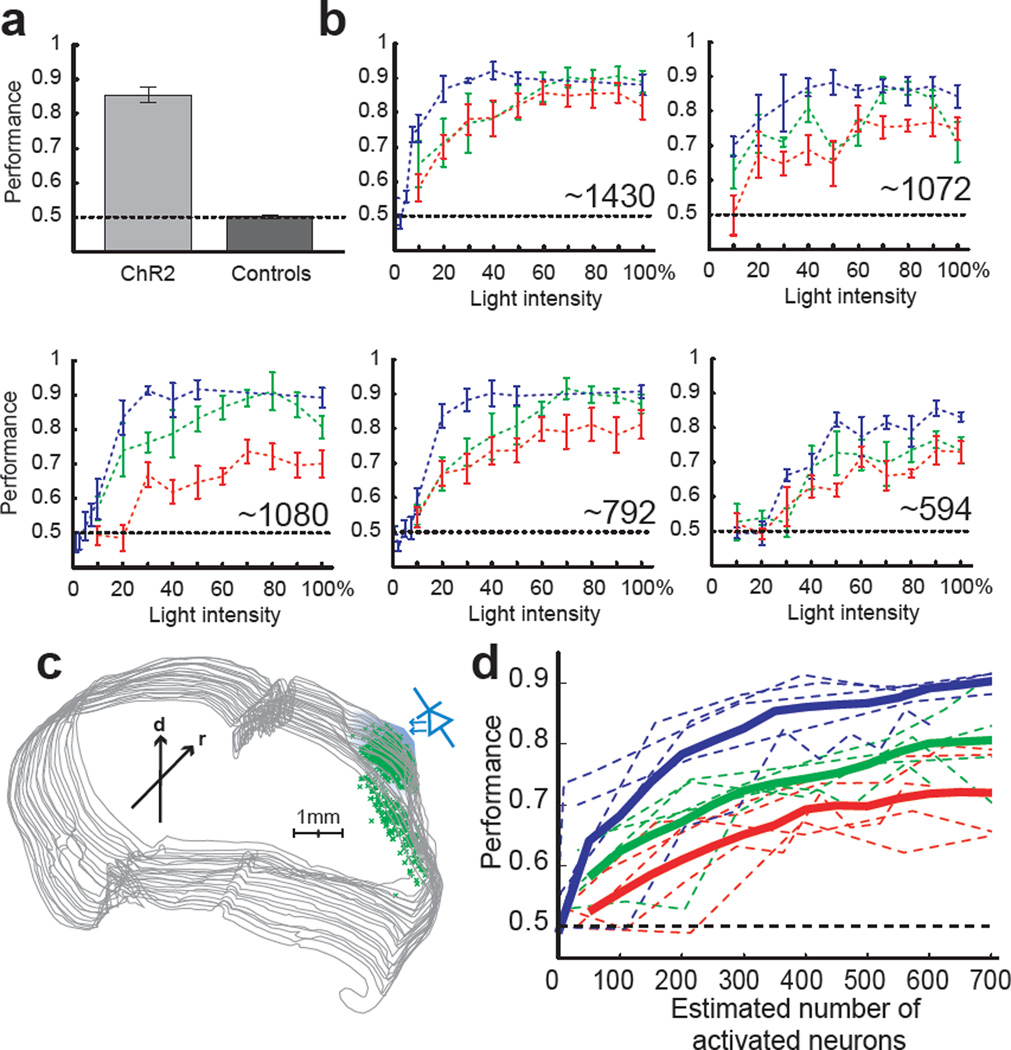
Electrical microstimulation can establish causal links between the activity of groups of neurons and perceptual and cognitive functions. However, the number and identities of neurons microstimulated, as well as the number of action potentials evoked, are difficult to ascertain. To address these issues we introduced the light-gated algal channel channelrhodopsin-2 (ChR2) specifically into a small fraction of layer 2/3 neurons of the mouse primary somatosensory cortex. ChR2 photostimulation in vivo reliably generated stimulus-locked action potentials at frequencies up to 50 Hz. Here we show that naive mice readily learned to detect brief trains of action potentials (five light pulses, 1 ms, 20 Hz). After training, mice could detect a photostimulus firing a single action potential in approximately 300 neurons. Even fewer neurons (approximately 60) were required for longer stimuli (five action potentials, 250 ms). Our results show that perceptual decisions and learning can be driven by extremely brief epochs of cortical activity in a sparse subset of supragranular cortical pyramidal neurons.
Figures
Similar articles
-
Chloride conducting light activated channel GtACR2 can produce both cessation of firing and generation of action potentials in cortical neurons in response to light.Neurosci Lett. 2017 Feb 15;640:76-80. doi: 10.1016/j.neulet.2017.01.026. Epub 2017 Jan 16. Neurosci Lett. 2017. PMID: 28093304
-
Behavioural report of single neuron stimulation in somatosensory cortex.Nature. 2008 Jan 3;451(7174):65-8. doi: 10.1038/nature06447. Epub 2007 Dec 19. Nature. 2008. PMID: 18094684
-
High-speed mapping of synaptic connectivity using photostimulation in Channelrhodopsin-2 transgenic mice.Proc Natl Acad Sci U S A. 2007 May 8;104(19):8143-8. doi: 10.1073/pnas.0700384104. Epub 2007 May 1. Proc Natl Acad Sci U S A. 2007. PMID: 17483470 Free PMC article.
-
In Vivo Observations of Rapid Scattered Light Changes Associated with Neurophysiological Activity.In: Frostig RD, editor. In Vivo Optical Imaging of Brain Function. 2nd edition. Boca Raton (FL): CRC Press/Taylor & Francis; 2009. Chapter 5. In: Frostig RD, editor. In Vivo Optical Imaging of Brain Function. 2nd edition. Boca Raton (FL): CRC Press/Taylor & Francis; 2009. Chapter 5. PMID: 26844322 Free Books & Documents. Review.
-
Insights into cortical mechanisms of behavior from microstimulation experiments.Prog Neurobiol. 2013 Apr;103:115-30. doi: 10.1016/j.pneurobio.2012.01.006. Epub 2012 Jan 28. Prog Neurobiol. 2013. PMID: 22307059 Free PMC article. Review.
Cited by
-
Differences in sensitivity to neural timing among cortical areas.J Neurosci. 2012 Oct 24;32(43):15142-7. doi: 10.1523/JNEUROSCI.1411-12.2012. J Neurosci. 2012. PMID: 23100435 Free PMC article.
-
Probing perceptual decisions in rodents.Nat Neurosci. 2013 Jul;16(7):824-31. doi: 10.1038/nn.3410. Epub 2013 Jun 25. Nat Neurosci. 2013. PMID: 23799475 Free PMC article. Review.
-
Improving focality and consistency in micromagnetic stimulation.Front Comput Neurosci. 2023 Feb 2;17:1105505. doi: 10.3389/fncom.2023.1105505. eCollection 2023. Front Comput Neurosci. 2023. PMID: 36817316 Free PMC article.
-
Direct activation of sparse, distributed populations of cortical neurons by electrical microstimulation.Neuron. 2009 Aug 27;63(4):508-22. doi: 10.1016/j.neuron.2009.07.016. Neuron. 2009. PMID: 19709632 Free PMC article.
-
Optimizing Optogenetic Activation of Purkinje Cell Axons to Investigate the Purkinje Cell - DCN Synapse.Front Synaptic Neurosci. 2019 Nov 22;11:31. doi: 10.3389/fnsyn.2019.00031. eCollection 2019. Front Synaptic Neurosci. 2019. PMID: 31824291 Free PMC article.
References
-
- Penfield W, Boldery P. Somatic motor and sensory representation in the cerebral cortex of man as studied by electrical stimulation. Brain. 1937;60:389–443.
-
- Salzman CD, Britten KH, Newsome WT. Cortical microstimulation influences perceptual judgements of motion direction. Nature. 1990;346:174–177. - PubMed
-
- Romo R, Hernandez A, Zainos A, Salinas E. Somatosensory discrimination based on cortical microstimulation. Nature. 1998;392:387–390. - PubMed
-
- Libet B. In: Handbook of Sensory Physiology. Iggo A, editor. Springer: Berlin; 1973.
Publication types
MeSH terms
Substances
Grants and funding
LinkOut - more resources
Full Text Sources
Other Literature Sources
