. 2008 Jan;10(1):30-41.
doi: 10.1038/ncb1666. Epub 2007 Dec 16.

ARF1 is directly involved in dynamin-independent endocytosis

Affiliations

ARF1 is directly involved in dynamin-independent endocytosis

Sudha Kumari et al. Nat Cell Biol. 2008 Jan.

Abstract

Endocytosis of glycosylphosphatidyl inositol (GPI)-anchored proteins (GPI-APs) and the fluid phase takes place primarily through a dynamin- and clathrin-independent, Cdc42-regulated pinocytic mechanism. This mechanism is mediated by primary carriers called clathrin-independent carriers (CLICs), which fuse to form tubular early endocytic compartments called GPI-AP enriched endosomal compartments (GEECs). Here, we show that reduction in activity or levels of ARF1 specifically inhibits GPI-AP and fluid-phase endocytosis without affecting other clathrin-dependent or independent endocytic pathways. ARF1 is activated at distinct sites on the plasma membrane, and by the recruitment of RhoGAP domain-containing protein, ARHGAP10, to the plasma membrane, modulates cell-surface Cdc42 dynamics. This results in the coupling of ARF1 and Cdc42 activity to regulate endocytosis at the plasma membrane. These findings provide a molecular basis for a crosstalk of endocytosis with secretion by the sharing of a key regulator of secretory traffic, ARF1.


Figures

Figure 1
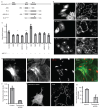
Figure 1. GDP-exchange deficient ARF1 inhibits uptake of GPI-APs and the fluid-phase.
(a) IA2.2 cells (CHO cells expressing FR-GPI (FR) and human TfR) were transiently transfected with ARF1T31N–GFP (outlined cells) for 18 h, and pulsed with Alexa568Mov19 Fabs and Alexa647 Tf (upper panels) or TMR–Dex (lower panels) for 10 min and processed for imaging. Images of internalized FR (red), TfR (green) and the fluid-phase (Fluid; red), are shown in grey-scale and colour merge. In transfected IA2.2 cells, the intracellular distribution of TfR containing perinuclear recycling compartment (REC) is altered, but Tf-uptake is unaffected. (b) MEFs transfected with ARF1T31N–GFP for 20 h, were pulsed with labelled probes for 5 min, fixed and imaged on a confocal microscope. Grey-scale and colour merge images of internalized Cy5–CTxB (CTx; red) with TMR–Dex (lower panel; green) or Alexa568Tf (upper panel; green) from a single confocal section are shown (transfected cells are outlined). In transfected cells, uptake of CTxB is blocked and fluid uptake is significantly reduced while TfR-uptake is unaffected. (c) Histogram showing uptake of TfR, FR-GPI (normalized to surface receptor expression level) and fluid-phase in ARF1T31N transfected cells plotted as a ratio to corresponding uptake measured in control cells. The error bars represent the weighted mean of fluorescence intensities ± s.e.m. (n = 61, 68, 100, 77, 63, 68; asterisks represent the cells transfected withARF1T31N). The scale bars in a and b represent 10 μm.
Figure 2
Figure 2. GEEC pathway is inhibited by depletion of ARF1 protein.
(a, b) IA2.2 cells cotransfected with pEGFP-N1 and the indicated shRNA or pSUPER vector (mock) were monitored for endocytosis as described in Fig. 1 (a) or harvested for western blotting (b). The histogram (b) shows the average (± s. d.) of data from three experiments of normalized levels of ARF1 and ARF3 in cells sorted for GFP fluorescence, where the amount of ARF protein as detected on western blots is normalized to the actin level per lane, and expressed as a ratio with respect to the value obtained in mock-transfected sample. (c) Histogram showing quantification of endocytosed probes in the cells expressing GFP, where each bar represents endocytosed fluorescence intensity (normalized surface receptor expression, TfR and FR) expressed relative to that measured in mock-transfected cells. Values plotted are weighted mean ± s.e.m. (n = 126, 116, 91, 95, 96, 103, 92, 90, 113, 100, 110). (d) Scatter graph (and trend lines) showing variation of endocytosed PLR (FR–GPI) probe fluorescence intensities versus surface FR–GPI levels in individual cells transfected with indicated shRNA, from ≥80 cells per condition. FR–GPI uptake in cells was measured by monitoring endocytosed PLR as above, and surface levels of FR–GPI were quantified by measuring cell surface Cy5–Mov19 binding capacity. (e) Histogram showing the amount of endocytosed HRP in cells transfected with vector alone (control) or ARF1 shRNA. Each bar represents the average of HRP activity normalized to the control, from two representative experiments ± s.d. Western blot shows the extent of reduction in ARF1 levels in cells taken for HRP uptake assays. The scale bar in a represents 20 μm.
Figure 3
Figure 3. RNAi-resistant ARF1 reverts shRNA-mediated inhibition of the GEEC pathway.
(a) Silent nucleotide substitutions in primers employed to create ARF1 RNAi-resistant (RR) form are highlighted in bold-type, with respect to positions in wild-type (WT) ARF1. (b) IA2.2 cells transfected with ARF1 RR–GFP (control), ARF1 shRNA alone, or ARF1 shRNA and ARF1 WT–GFP (ARF1 shRNA/WT), or ARF1 shRNA and ARF1 RR–GFP (ARF1 shRNA/RR), were assessed for endocytosis of the fluid phase 60 h post-transfection. The histogram shows the quantification of fluid uptake in the indicated GFP-expressing cells. The error bars represent weighted mean, normalized to untransfected (control) cells, ± s.e.m.(n = 89, 81, 109, 84, 97). This experiment was repeated twice with similar results. (c) Cells transfected with indicated expression vectors for 60 h were fixed and processed for immunofluorescence microscopy to detect ARF1 levels. ARF1 RR–GFP overexpressing cells are marked with an asterisk. Note that coexpression of ARF1 RR–GFP with shRNA restores the ARF1-antibody staining levels comparable to unmarked cells in ARF1 RR panel. (d) Histogram representing the average GFP-fluorescence intensity in cells cotransfected with ARF1 shRNA together with ARF1 WT–GFP or ARF1 RR–-GFP, normalized to GFP fluorescence levels in ARF1 RR–GFP transfected cells. The error bars represent weighted mean of GFP intensities detected in individual cells (arbitrary units, AU) ± s.e.m.(n = 120, 91). This experiment was repeated twice with similar results. (e) Overexpression of ARF1 RR–GFP in ARF1 shRNA transfected cells restores typical Golgi morphology as assessed by monitoring GM130 antibody staining pattern. Approximately 70% of cells transfected with ARF1 shRNA exhibited a disrupted Golgi pattern. Note GM130 staining in the shRNA-expressing outlined cell versus surrounding untransfected cells. In contrast, only approximately 30% of cells exhibit this phenotype in cells cotransfected with ARF1 RR–GFP (n ≥80). The scale bars in b, c and e represent 10 μm.
Figure 4
Figure 4. Brefeldin A inhibits surface delivery of GPI-APs, but enhances endocytosis via the GEEC pathway.
(a) CHO cells transiently transfected with CFP–GPI were grown at 20 °C for 16 h and then shifted to 37 °C in presence (+BFA, 20 μg ml–1) or absence of Brefeldin A (–BFA) for 1 h. Surface levels of CFP–GPI, monitored by labelling cells with anti-CFP at 4 °C, shows that BFA-treatment blocks exocytic delivery of CFP–GPI. The histogram shows anti-CFP antibody fluorescence at the surface of cells, normalized to total CFP–GPI expression per cell, and plotted as a ratio to the cell surface levels measured at 20 °C. The error bars represent weighted mean ± s.e.m. (n = 56, 40, 55). (b) IA2.2 cells, treated with BFA (20 μg ml–1 for 1 h at 37 °C) were assayed for FR–GPI and the fluid-phase uptake as described in Fig. 1. In BFA-treated cells, fluid-phase and FR–GPI uptake is enhanced. (c) Histogram showing quantification of fluorescence of endocytosed probes (normalized to FR–GPI expression at the surface for FR-GPI uptake) in cells treated with BFA in the presence or absence of ARF1T31N transfection, represented as the ratio of uptake to that observed in untreated cells (control). The error bars represents weighted mean ± s.e.m. (n = 98, 139, 71 for fluid and 103, 112, 64 for FR). The single and double asterisks represent P values (<0.002) from the indicated comparisons. The scale bars in a and b represent 10 μm.
Figure 5
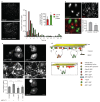
Figure 5. ARF1 functions via ARHGAP10.
(a) Deletion constructs of ARHGAP10 with different domains. ARF binding domain, ABD; RhoGAP domain, R-G; ABD and R-G domain, ABD/R-G; R-G domain mutated for GAP activity, R-GR1183A. (b) IA2.2 cells transfected with either singly with GFP–ABD, HA–ARF1Q71L or with both constructs were assayed for endocytosis of FR–GPI. Expression of GFP–ABD reduces, whereas ARF1Q71L expression enhances FR–GPI uptake. Endocytosed FR–GPI is more peripherally distributed in ARF1Q71L-expressing cells. Coexpression of both proteins (outlined cells) shows that GFP–ABD expression antagonizes ARF1Q71L-mediated endocytic enhancement. (c) Histogram showing quantification of internalized FR–GPI in cells expressing the indicated combination of constructs, normalized to that measured in GFP-transfected cells. The error bars represent weighted mean ± s.e.m. (n = 66, 49, 54, 57, 50, 50, 44, 56, 49). The single asterisk and the double asterisk represent P values ≤0.01, and 0.2, respectively. (d) MEFs transfected with ARHGAP10 shRNA for 72 h were fixed and stained for actin organization and Golgi morphology (GM130). Note that in transfected cells, the actin distribution is altered and Golgi is dispersed. This F-actin reorganization is observed in approximately 30% of transfected cells and change in Golgi morphology is observed in approximately 60% cells. (e) Histogram showing levels of anti-V5 antibody staining in V5-tagged ARHGAP10 N-terminal domain coexpressed with eGFP-N1 (control) or ARHGAP10 shRNA in CHO cells. The error bars represent weighted mean of average of V5 intensities per cell ± s.e.m. (n = 97, 82). (f) MEFs expressing ARHGAP10 shRNA (outlined, green in merge) exhibit a reduction in fluid-phase uptake (outlined, right panel) compared with surrounding untransfected cells. Images are single confocal plane representing either transfection marker or internalized fluid. (g) Histogram showing the percentage of cells (MEFs) that exhibit a normal fluid-phase uptake in cells expressing GFP alone (control) or ARHGAP10 shRNA, when compared to untransfected cells. The error bars represent average of data from three independent experiments ± s.d. (n = 35, 56). The scale bars represent 20 μm.
Figure 6
Figure 6. Activated ARF1 is located at the plasma membrane and on fluid-containing nascent endosomes.
(a) IA2.2 cells transfected with ARF1–GFP and GFP–ABD expression vectors as indicated were sequentially imaged using TIRF and wide-field illumination. ARF1–GFP and GFP–ABD appear enriched on the Golgi in the wide-field (inset), whereas in the same cells distinct punctate foci of these proteins are visible in the TIRF field. Cotransfection of cells with HA–ARF1T31N and ARF1 shRNA removes these foci from the plasma membrane. (b) Histogram showing the fraction of GFP–ABD transfected cells with punctate distribution on cotransfection with ARF1T31N or ARF1 shRNA. The error bars represent weighted mean ± s.e.m. (n = 45, 36, 42). (c) IA2.2 cells transfected with ARF1–GFP and RFP–ABD were imaged live using sequential TIRF illumination. The delay between acquisition of ARF1 and ABD images is 200 ms. Note that in merge of ARF1 and ABD images, all the ABD puncta colocalize with ARF1. A portion of merge (box) is magnified in e. (e) IA2.2 cells transfected with ARF1–GFP (left, green) or GFP–ABD (right, green) were pulsed with TMR–Dex (Fluid, red) for 40 s at 37 °C, washed, fixed and imaged. Insets show a magnified view of the region demarcated with a square, where there is extensive colocalization of the two colours. The scale bars in a, d and e represent 10 μm.
Figure 7
Figure 7. ARF1 activation couples to Cdc42 dynamics at plasma membrane.
(a) IA2.2 cells expressing Cdc42–GFP, without or with cotransfection of ARF1 shRNA were imaged at 37 °C under TIRF illumination to visualize distribution of single molecules of Cdc42 at the plasma membrane. The histogram shows that the mean residence time of Cdc42 (indicated by arrows) and the average number of molecules (± s.d.) shown in the inset, increase in ARF1 shRNA transfected cells. Data are from one experiment out of two with similar results, where 12 cells in each condition were analysed. The asterisk indicates P ≤0.006. (b) IA2.2 cells transfected with GFP–Cdc42L61 (green in merge) were pulsed with TMR–Dex (red in merge), fixed and imaged. The histogram shows the uptake of TMR–Dex in cells expressing GFP–Cdc42L61 normalized to untransfected cells from a single experiment, repeated twice with similar results. The error bars represent weighted mean ± s.e.m. (n = 50, 58). The asterisk represents P ≤0.002. (c) IA2.2 cells transfected with HA–ARF1Q71L either alone or with Cdc42N17 were assayed for FR–GPI uptake (FR), and processed for detection of HA–ARF1Q71L and GFP. The histogram shows quantification of endocytosed Alexa568–Mov19 Fab fluorescence (normalized to surface FR–GPI levels) in cells expressing ARF1Q71L, cotransfected with GFP–Cdc42N17, or treated with Toxin B (1 μg ml–1 for 60 min), plotted as a ratio to uptake measured in untransfected (control) cells. The error bars represent weighted mean ± s.e.m. (n = 60, 78, 73, 79). The single and double asterisks represent P ≤0.003 for the indicated comparisons. (d) In a model for ARF1-dependent regulation of endocytosis via GEEC pathway, ARF1 is activity is governed by a BFA-resistant GEF and a GAP of unknown identity (?). Activated ARF1 recruits ARHGAP10 to function as a RhoGAP for Cdc42, resulting in inactivation and release of Cdc42 into cytosol. Activated Cdc42 regulates dynamic actin polymerization that leads to formation of endosomes via the GEEC pathway. However, persistent activation of Cdc42 (due to constitutively activated Cdc42 or loss of ARHGAP10-based RhoGAP activity) leads to a different type of actin architecture (see box), incompatible with endocytosis via the GEEC pathway. The scale bars in a, b and c represent 10 μm.

Similar articles

Cited by

References

    1. Conner SD, Schmid SL. Regulated portals of entry into the cell. Nature. 2003;422:37–44. - PubMed
    1. Kirkham M, Parton RG. Clathrin-independent endocytosis: new insights into caveolae and non-caveolar lipid raft carriers. Biochim Biophys Acta. 2005;1746:350–363. - PubMed
    1. Mayor S, Pagano RE. Pathways of clathrin-independent endocytosis. Nature Rev Mol Cell Biol. 2007;8:603–612. - PMC - PubMed
    1. Sabharanjak S, Sharma P, Parton RG, Mayor S. GPI-anchored proteins are delivered to recycling endosomes via a distinct cdc42-regulated, clathrin-independent pinocytic pathway. Dev Cell. 2002;2:411–423. - PubMed
    1. Kirkham M, et al. Ultrastructural identification of uncoated caveolin-independent early endocytic vehicles. J Cell Biol. 2005;168:465–476. doi: 10.1083/jcb.200407078. - DOI - PMC - PubMed

Publication types

MeSH terms

LinkOut - more resources