. 2008 Mar 30;373(1):85-97.
doi: 10.1016/j.virol.2007.10.042. Epub 2007 Dec 20.

HIV-1 accessory proteins VPR and Vif modulate antiviral response by targeting IRF-3 for degradation

Affiliations

HIV-1 accessory proteins VPR and Vif modulate antiviral response by targeting IRF-3 for degradation

Atsushi Okumura et al. Virology. .

Abstract

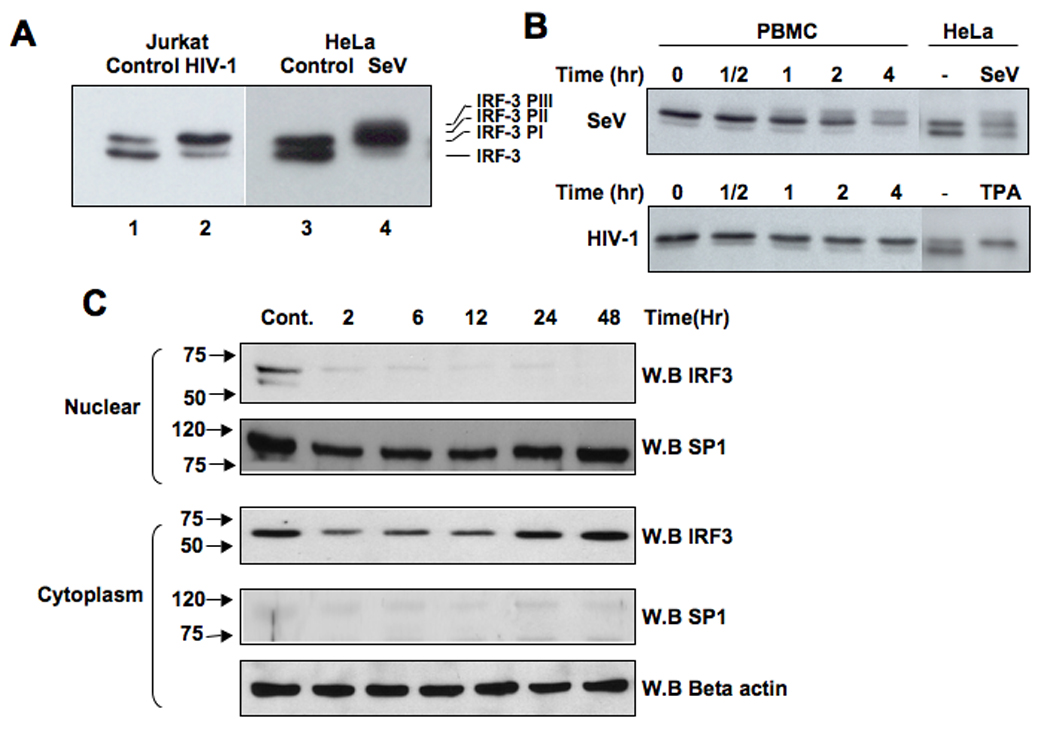
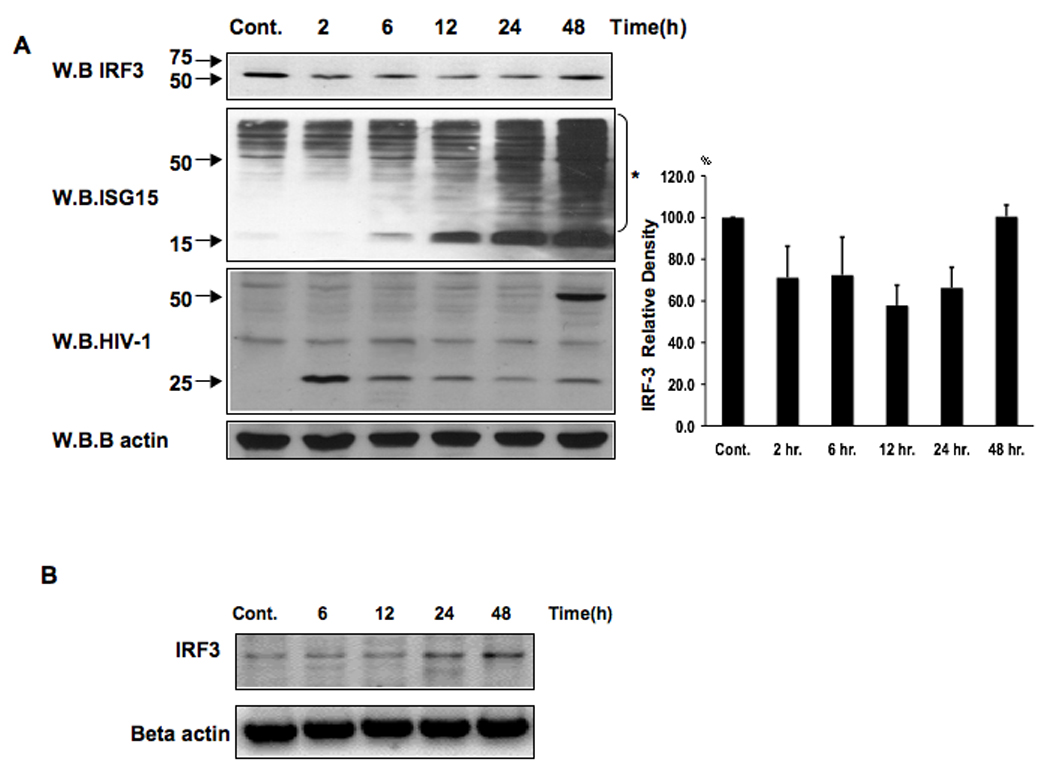
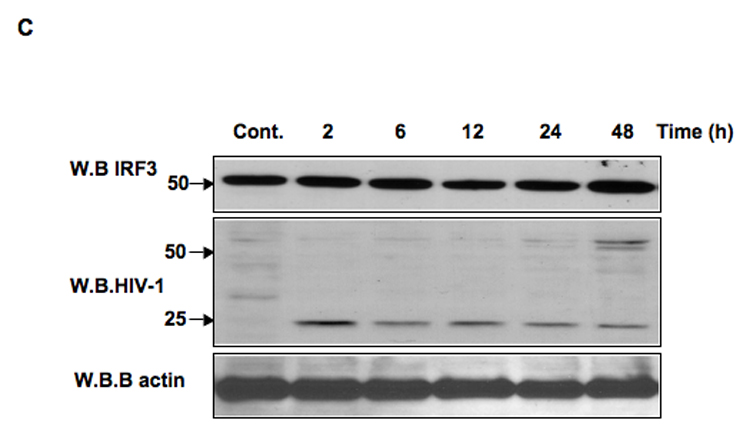
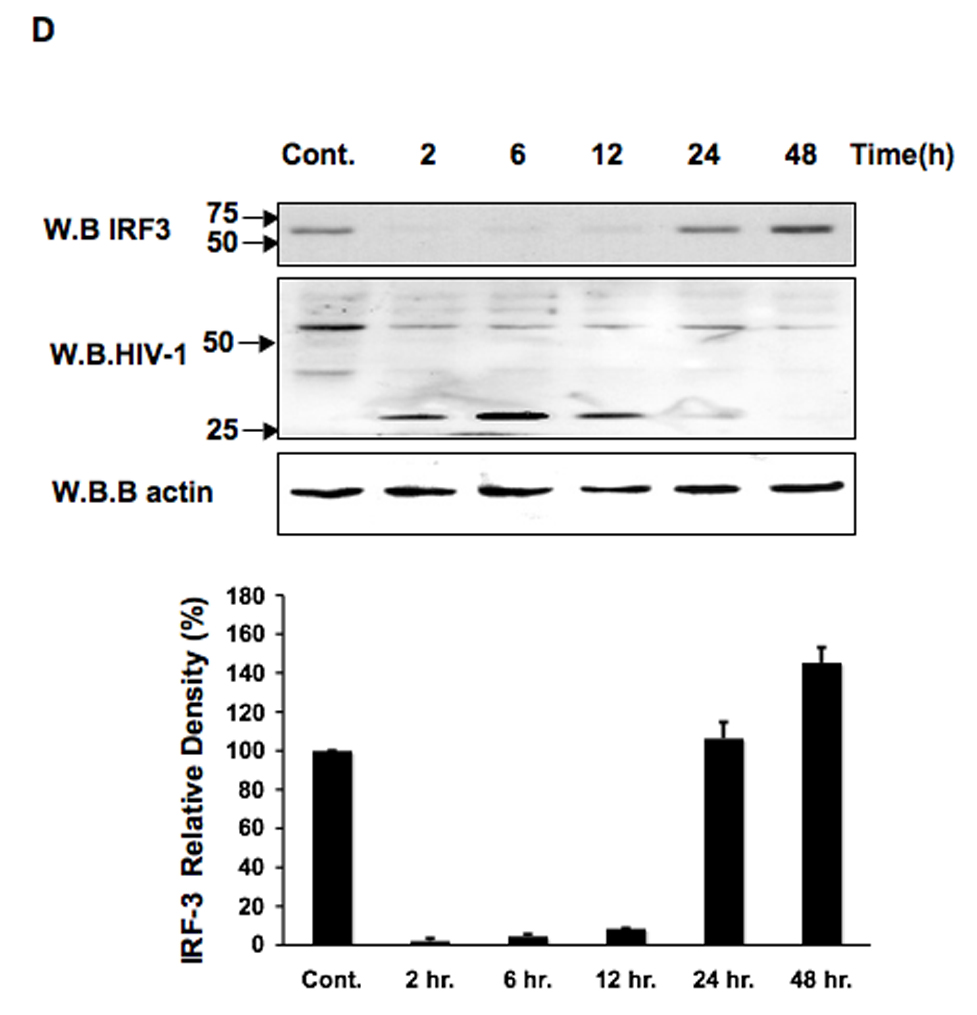
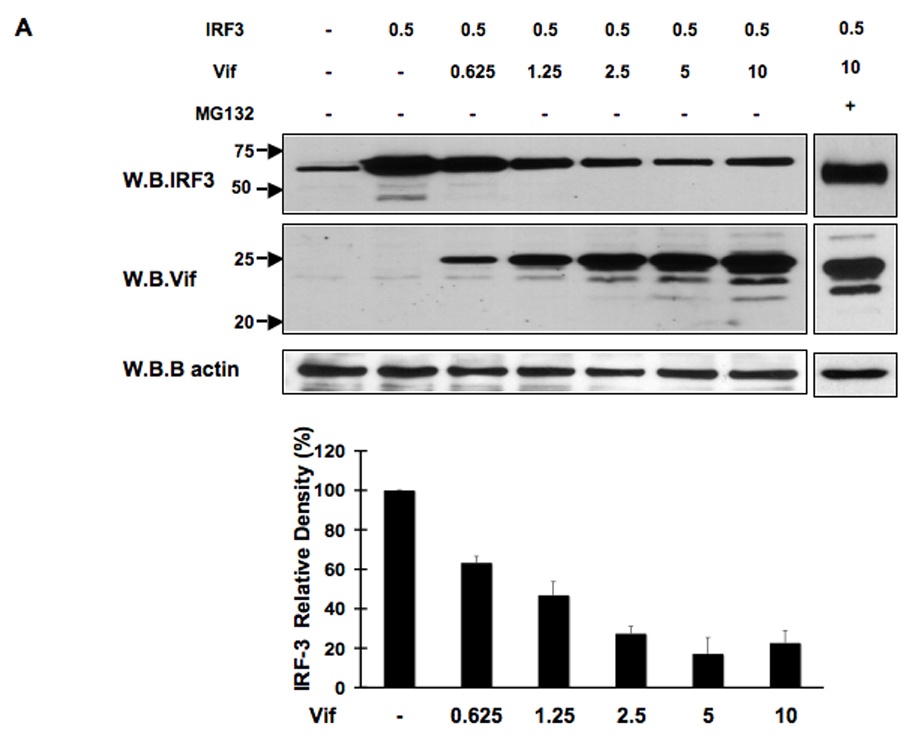
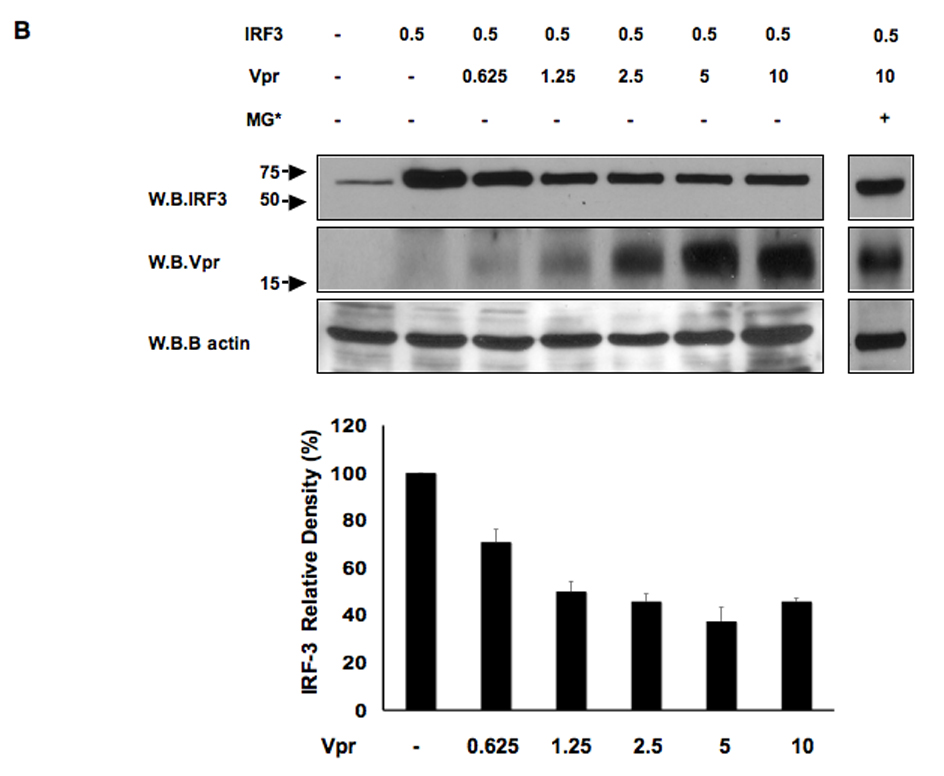
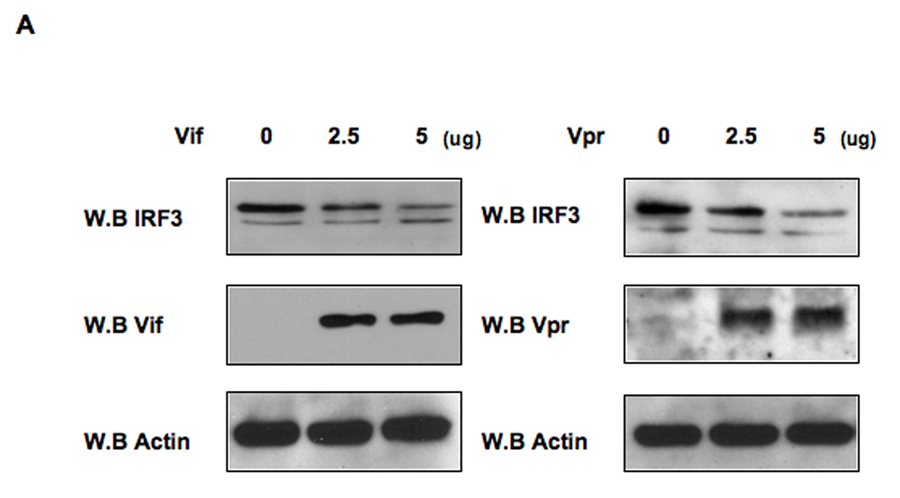
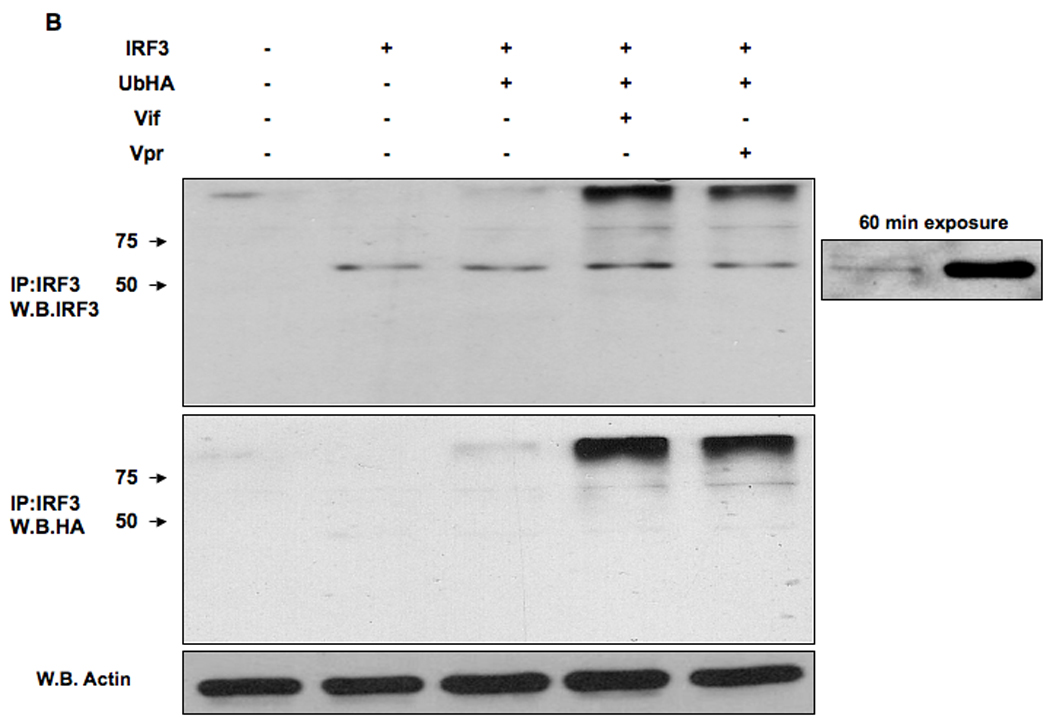
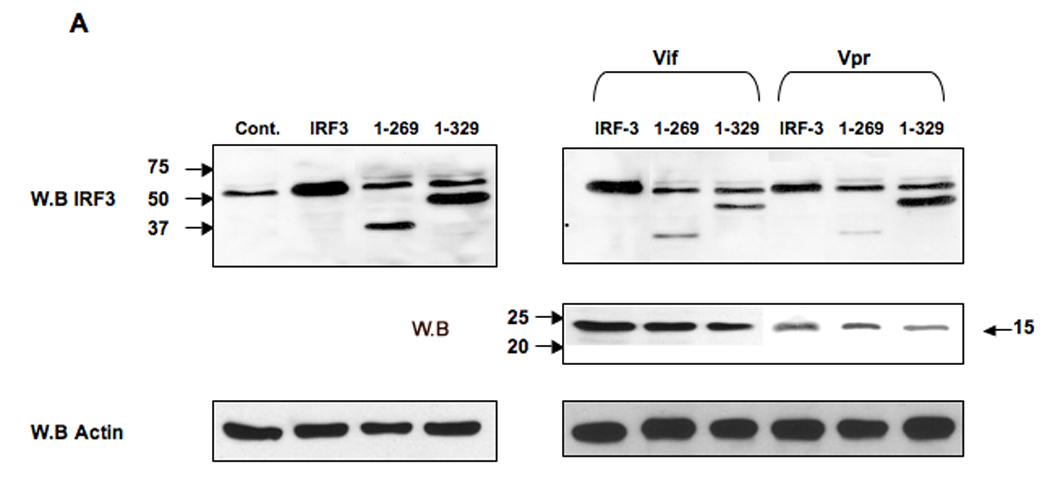
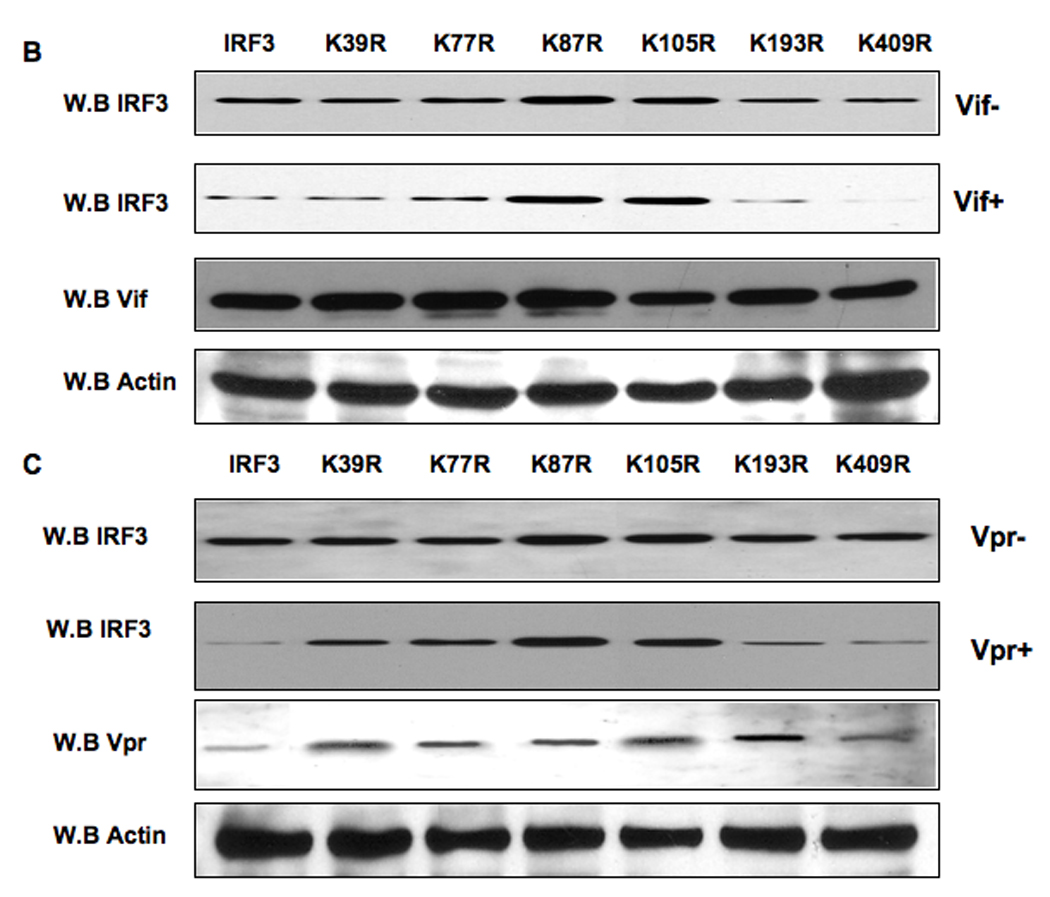
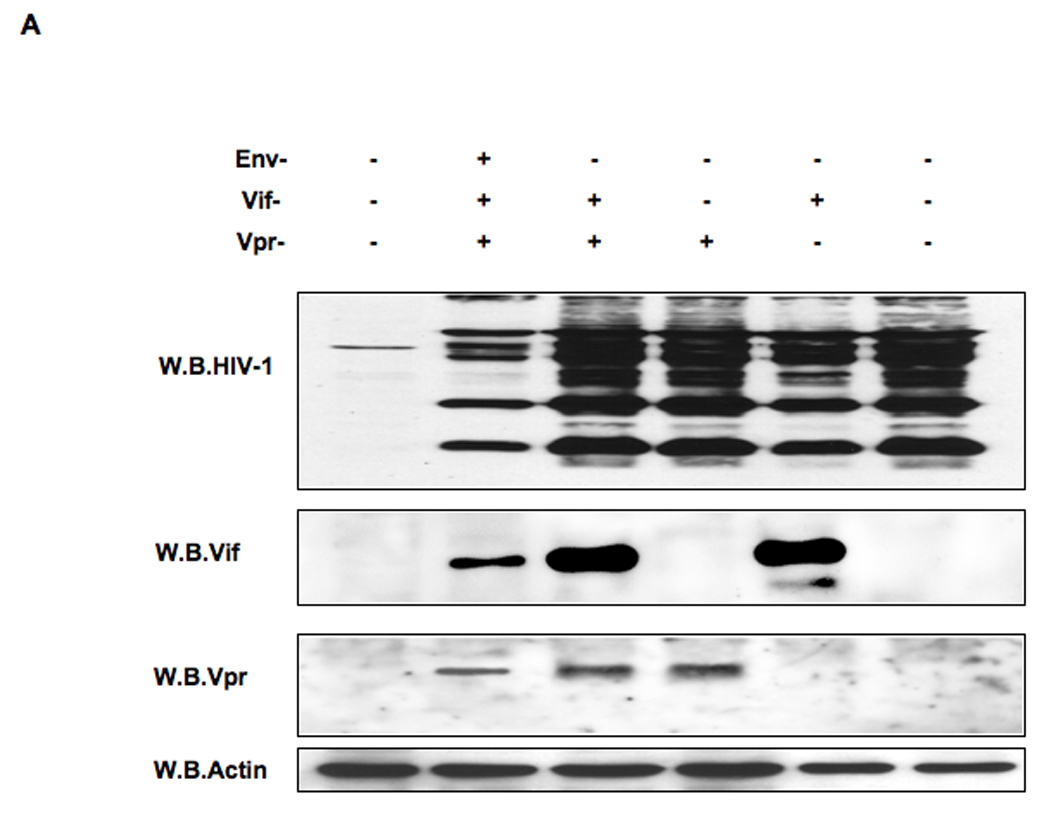
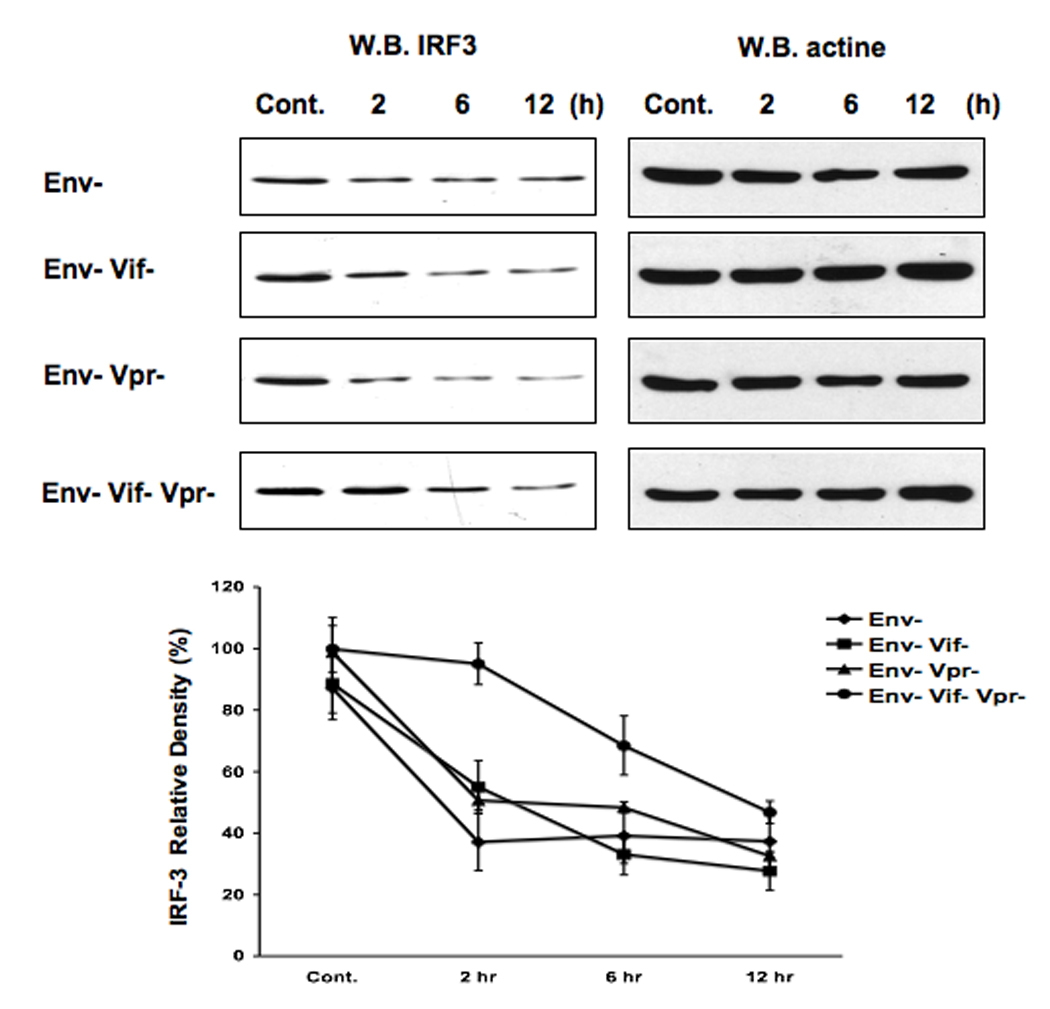
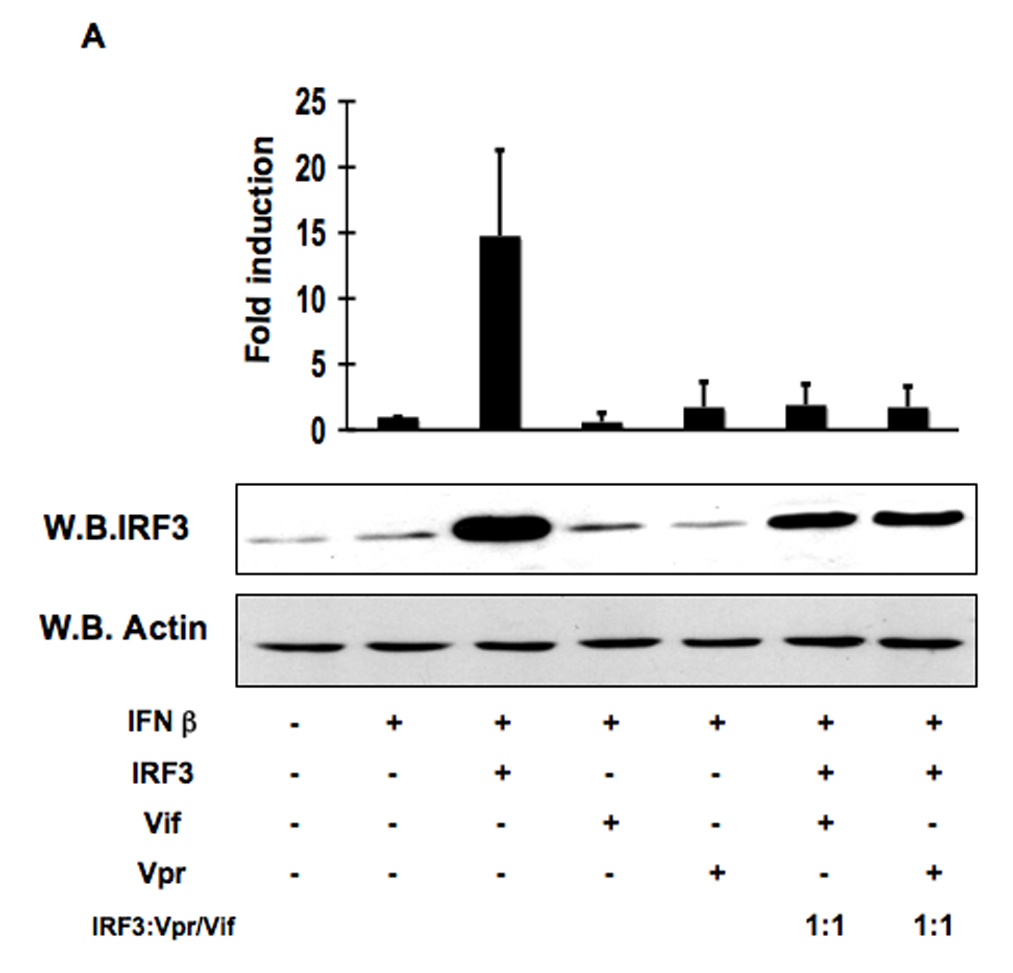
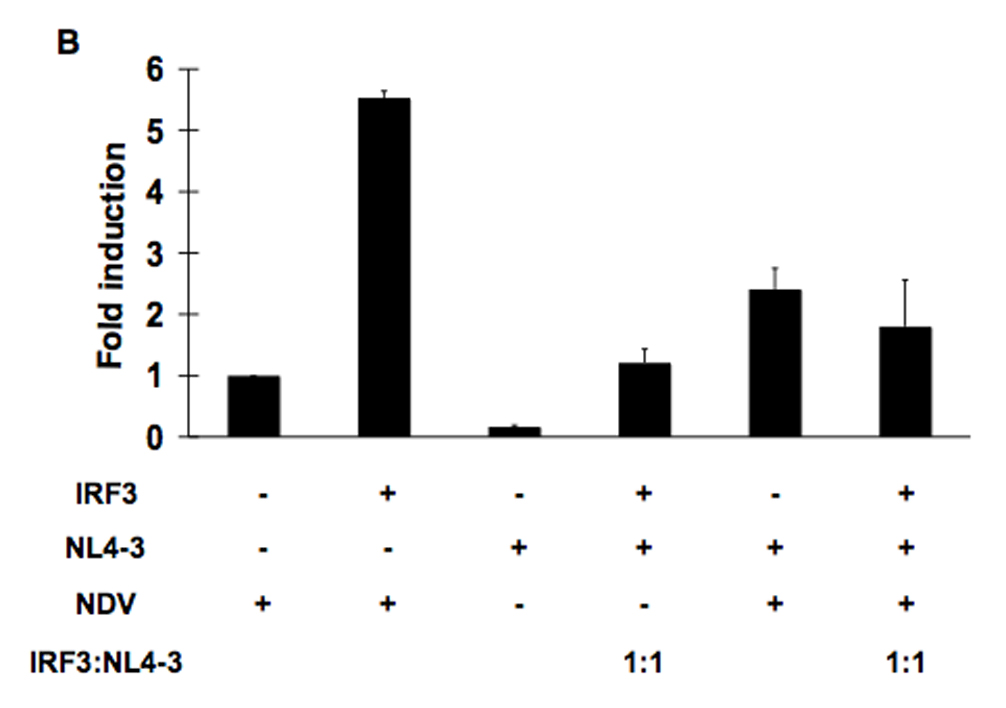
The activation of IRF-3 during the early stages of viral infection is critical for the initiation of the antiviral response; however the activation of IRF-3 in HIV-1 infected cells has not yet been characterized. We demonstrate that the early steps of HIV-1 infection do not lead to the activation and nuclear translocation of IRF-3; instead, the relative levels of IRF-3 protein are decreased due to the ubiquitin-associated proteosome degradation. Addressing the molecular mechanism of this effect we show that the degradation is independent of HIV-1 replication and that virion-associated accessory proteins Vif and Vpr can independently degrade IRF-3. The null mutation of these two genes reduced the capacity of the HIV-1 virus to down modulate IRF-3 levels. The degradation was associated with Vif- and Vpr-mediated ubiquitination of IRF-3 and was independent of the activation of IRF-3. N-terminal lysine residues were shown to play a critical role in the Vif- and Vpr-mediated degradation of IRF-3. These data implicate Vif and Vpr in the disruption of the initial antiviral response and point to the need of HIV-1 to circumvent the antiviral response during the very early phase of replication.


Conflict of interest statement

Conflict of interest statement. No conflicts declared.

Figures

Figure 1
Figure 1. IRF-3 is not activated and translocated to the nucleus during the early stages of HIV-1 infection
(A) Jurkat cells were incubated on ice with HIV-1(NL4-3) (moi 10) for 1 h prior to incubation at 37°C for 1h. HeLa cells were incubated with Sendai virus (SeV) (moi 5) for 2h at 37°C. Moi was calculated as described in Methods. Cells were then washed with PBS and harvested in NP40 lysis buffer. Soluble proteins were separated on 7.5% SDS PAGE, transferred to PVDF membrane, blotted with anti-IRF-3 polyclonal antibody and detected by ECL. (B). Time course of IRF-3 phosphorylation following virus infection. PBMC were incubated with HIV-1 (moi 5) or SeV (moi 5) in duplicate experiments to that described above. Samples were taken at the times indicated, lysates were prepared and IRF-3 detected as described in A. Samples from control (+), SeV and TPA treated HeLa cells are shown for comparison of gel migration. (C). HIV-1 infection does not induce nuclear translocation of IRF-3. PM1 cells were infected with HIV-1 (AD8) (moi 10) as described in methods. Cells were harvested at the indicated times post infection and the levels of IRF-3 in the nuclear and cytoplasmic fractions were determined by immunoblotting. The equal amounts (15 µg) of protein were loaded on the gel. Sp1 is a nuclear protein therefore its levels in nucleus were determined as a control for equal loading. Levels in cytoplasm were determined as a control for the purity of nuclear fraction and absence of leaking of nuclear protein to cytoplasm. The levels of β actin were determined as controls for equal protein loading.
Figure 2
Figure 2. HIV-1 infection induces degradation of endogenous IRF-3
(A). PM1 cells were pre- treated with polybrene (5ug/ml) for 1 h and infected with HIV-1, (AD8) (moi 10) for 1 h at 4° C. Cells were washed with PBS and incubate at 37C for indicated times. Cells were then collected and lysates were analyzed by Western blot with IRF3, ISG15, HIV-1 and β-actin antibodies. Insert: The density of the IRF-3 bands was scanned, normalized to the density of the actin band and the values of the controls were designated as 100%. The normalized integrated density values were plotted as a function of time. (B) Semi-quantitative RT-PCR of IRF3 transcripts in HIV-1 infected PM1 cells. RNA was isolated at indicated time post HIV-1 infection (moi 10), and amplified using IRF3 specific primers; the cDNA were amplified in a linear region of the PCR curve. The nucleotide sequences of the primers are given in Methods. (C). Degradation of IRF-3 is inhibited by the proteasome inhibitor (MG132). PM1 cells were treated with the proteasome inhibitor MG132 (5uM) for 2h, infected with HIV-1 (moi 10) and then incubated in the presence of MG132 for indicated times. Cells were then collected, lysed and analyzed by Western blot for the presence of IRF-3, HIV-1 proteins and β actin as described in Methods. (D). Azidothymidine (AZT) treatment does not prevent degradation of IRF3 in HIV-1 infected cells. PM1 cells were pre-treated with AZT (10 µM) for 12 h and then infected with HIV-1. At indicated time post infection, cell lysates were immunoblotted with IRF3, HIV-1 and β actin antibodies. Control samples were pre-treated with AZT for 12h and than treated with AZT for additional 12 hr without HIV-1 infection. The 24KDa band represent the in input virion p24.
Figure 3
Figure 3. HIV-1 accessory proteins Vif and Vpr independently target IRF3 for ubiqutin mediated degradation
(A) 293T cells were co-transfected with IRF3 (0.5µg) and indicated amounts of Vif plasmid (0–10µg). The total amount of transfected DNA was held equivalent in all samples by using cDNA3 plasmid DNA. 12 h after the transfection, cell lysates were analyzed by Western blot with IRF-3, Vif and β actin polyclonal antibodies. The IRF-3 bands were scanned, normalized to a density of the β actin band and the values are expressed as % of the normalized IRF-3 expressed in the absence of Vif that was nominated as 100%. (B) 293T cells were co-transfected with IRF3 and the Vpr plasmid of indicated concentrations. The samples were analyzed for the presence of IRF-3 and Vpr and the relative levels of normalized IRF-3 were determined as described above Controls were transfected with the empty vector, pcDNA3 only. Western blots show representative data of one from three independent experiments. The error bars on the scan graph show variations between the individual experiments. Neither Vif nor Vpr induced IRF-3 degradation in the presence of proteasome inhibitor MG132.
Figure 4
Figure 4. Vif and Vpr induce degradation of endogenous IRF-3 and its ubiquitination
(A). Vif and Vpr induce dose dependant degradation of the endogenous IRF3. 293T cell were transfected with Vif or Vpr expressing plasmids and 12 h post transfection cells were harvested and cell lysates analyzed by immuno blotting with IRF-3, Vif or Vpr and β actin polyclonal antibodies (B). 293T cells were transfected with IRF-3 (1µg) and Vif or Vpr(2 µg) and HA tagged ,ubiquitin expressing plasmids-UbHA (1µg). The total amount of transfected DNA was adjusted by pcDNA3 plasmids DNA. 24 h after the transfection, cell lysates were immunoprecipitated with IRF-3 polyclonal antibodies and the precipitates were immuno blotted with monoclonal IRF-3 and HA antibodies. Controls were transfected with pcDNA3 only.
Figure 5
Figure 5. Mapping of IRF3 ubiquitination domain by Vif and Vpr
(A) 293T cell were co-transfected with IRF-3 (1ìg) or its deletion plasmids encoding 1– 269 and 1–329 aa long IRF-3 peptides and Vpr or Vif expressing plasmids at the 1:1 or 1:10 IRF3: Vif or Vpr ratio. The total amount of transfected DNA was kept constant. Cells were harvested at 24 h post transfection and the relative levels of IRF-3, Vif and Vpr (left- central panel) in cell lysates were determined by immune blotting with specific antibody. The relative levels of actin were determined as controls for equal protein loading (B) IRF-3 (1µg) and its respective K-R mutants were co-transfected together with Vif plasmid (2 µg) to 293T cells. Cell lysates were prepared 24 h later and relative levels of IRF-3 and Vif determined by western blotting. (C) Transfection of IRF-3, its K-R mutants and Vpr was done as described in B. The levels of β- actin were determined as controls for protein loading.
Figure 6
Figure 6. Degradation of IRF3 is slow down in cell infected with HIV-1 mutant lacking both Vif and Vpr
(A) Analysis of the viral proteins expression encoded by pNL4-3HSA modified by site-directed mutagenesis in Vif and Vpr genes. The pNL43 DNA or pNL4-3HSA DNA (2 µg) and its Vif and Vpr deletion mutants were co-transfected together with the pMDG plasmid (1 µg) encoding VSV-G protein to 293T cells and 36 h post transfection, cell lysates were analyzed by Western blotting with HIV-1 antiserum and Vif or Vpr polyclonal antibodies. The Env- Vector cotransfected with pMDG served as a negative control. (B) Jurkat cells were infected with Env- HIV-1 (NL43HSA) VSV pseudotype and VSV psedotyped HIV-1 mutants (moi 10) lacking expression of either Vif, or Vpr or both of these genes. Cells were harvested at indicated times post infection and the lysates were immunoblotted with polyclonal IRF3 antibody. Levels of β actin were determined as 26 controls for protein loading. Western blot of a representative experiment is shown. The density of the IRF-3 bands was scanned, normalized to the density of the actin band and the normalized integrated density values were plotted as a function of time. The data represent analysis of three independent infections.
Figure 7
Figure 7. Vif and Vpr inhibit IRF3 mediated activation of IFNB promoter
(A) 293T cells were co-transfected with IRF-3 (1µg) and IFNB promoter–luciferase reporter plasmids (0.5 µg) in the presence or absence of Vif or Vpr expressing plasmids (1 µg). Cells were infected with NDV (moi 5) 12 h after the transfection and harvested for luciferase activity 16 h post infection. Renila construct was used as control for transfection efficiency. Luciferase activity was analyzed as described in Methods. (B) 293T cells transfected with indicated amounts of NL4-3 proviral DNA (1 µg), were transfected with IRF-3 expressing plasmid (1ug) and IFNB luciferase reporter plasmid (0.5µg). When indicated, cells were also infected with NDV (moi 5) 12 h after IRF-3 transfection and harvested and analyzed as described in A.

Similar articles

Cited by

References

    1. Akira S, Uematsu S, Takeuchi O. Pathogen recognition and innate immunity. Cell. 2006;124(4):783–801. - PubMed
    1. Au WC, Moore PA, Lowther W, Juang YT, Pitha PM. Identification of a member of the interferon regulatory factor family that binds to the interferon-stimulated response element and activates expression of interferon-induced genes. Proc Natl Acad Sci U S A. 1995;92(25):11657–11661. - PMC - PubMed
    1. Au WC, Yeow WS, Pitha PM. Analysis of functional domains of interferon regulatory factor 7 and its association with IRF-3. Virology. 2001;280(2):273–282. - PubMed
    1. Barry M, Fruh K. Viral modulators of cullin RING ubiquitin ligases: culling the host defense. Sci STKE 2006. 2006;(335):pe21. - PubMed
    1. Basler CF, Garcia-Sastre A. Viruses and the type I interferon antiviral system: induction and evasion. Int Rev Immunol. 2002;21(4–5):305–337. - PubMed

Publication types

MeSH terms

Substances