. 2008 Mar;82(5):2120-9.
doi: 10.1128/JVI.02053-07. Epub 2007 Dec 12.

Cellular determinants of hepatitis C virus assembly, maturation, degradation, and secretion

Affiliations

Cellular determinants of hepatitis C virus assembly, maturation, degradation, and secretion

Pablo Gastaminza et al. J Virol. 2008 Mar.

Abstract

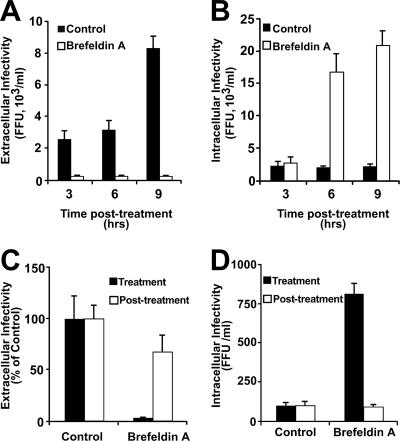
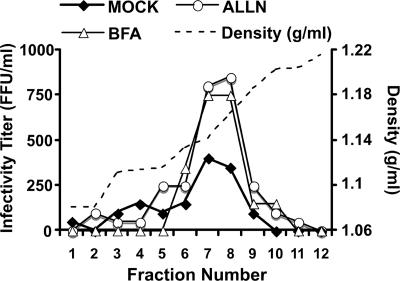
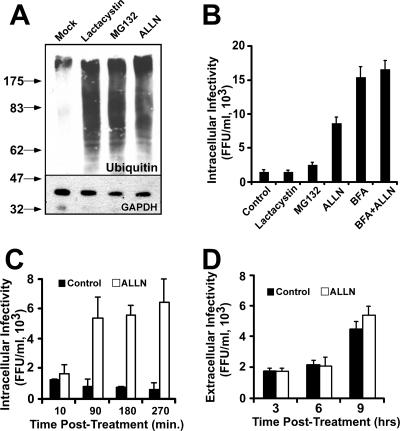
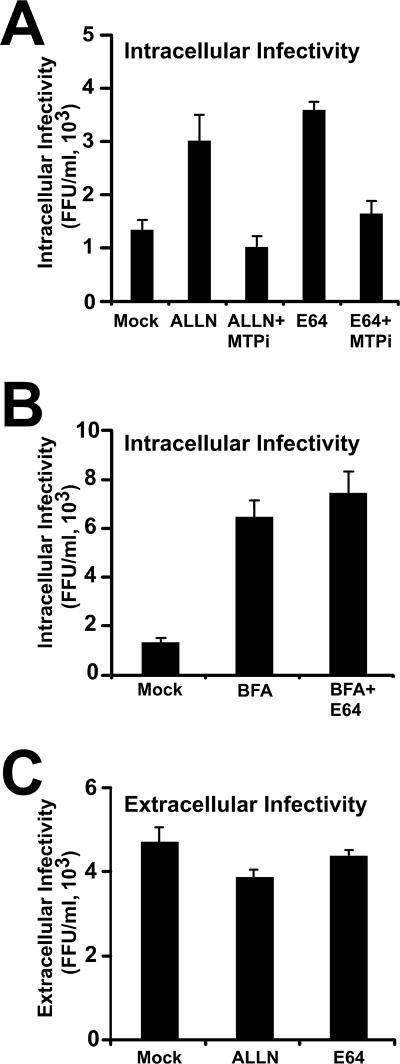
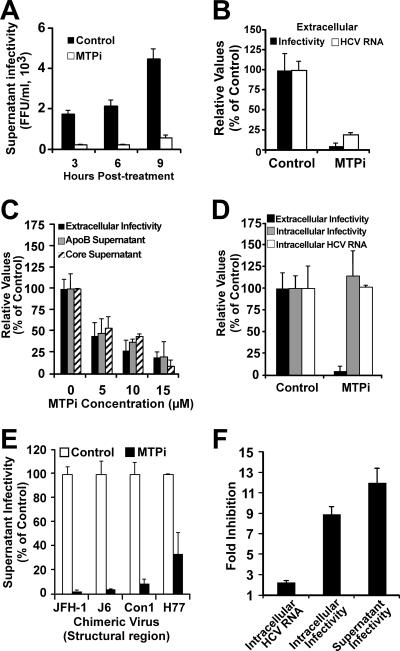
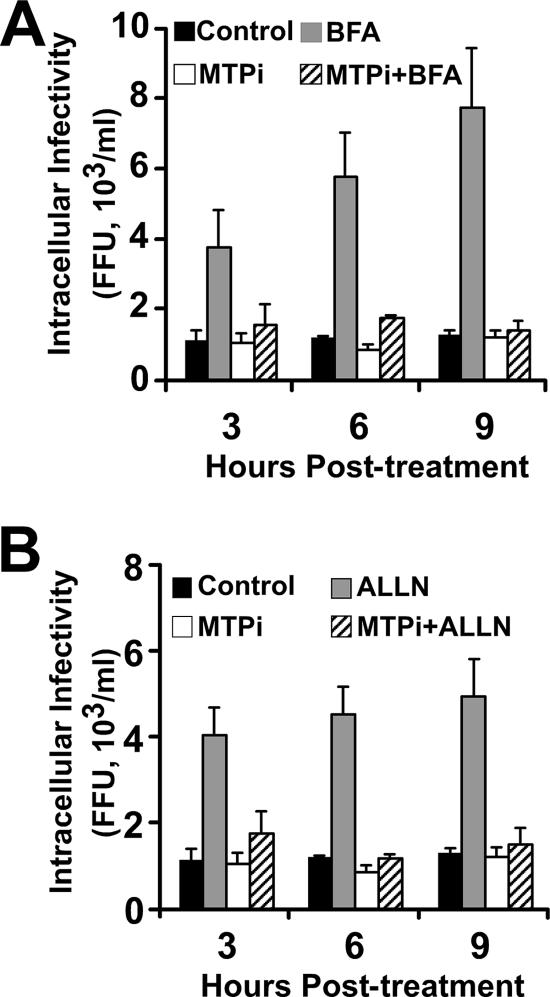
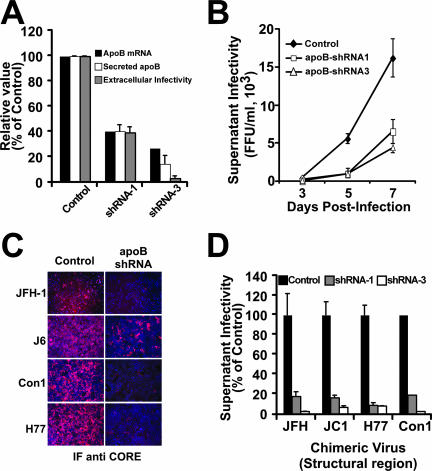
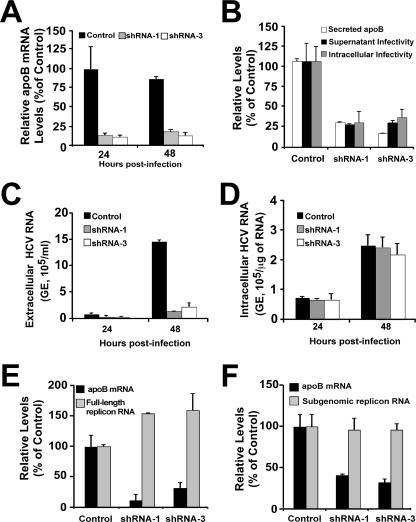
Intracellular infectious hepatitis C virus (HCV) particles display a distinctly higher buoyant density than do secreted virus particles, suggesting that the characteristic low density of extracellular HCV particles is acquired during viral egress. We took advantage of this difference to examine the determinants of assembly, maturation, degradation, and egress of infectious HCV particles. The results demonstrate that HCV assembly and maturation occur in the endoplasmic reticulum (ER) and post-ER compartments, respectively, and that both depend on microsomal transfer protein and apolipoprotein B, in a manner that parallels the formation of very-low-density lipoproteins (VLDL). In addition, they illustrate that only low-density particles are efficiently secreted and that immature particles are actively degraded, in a proteasome-independent manner, in a post-ER compartment of the cell. These results suggest that by coopting the VLDL assembly, maturation, degradation, and secretory machinery of the cell, HCV acquires its hepatocyte tropism and, by mimicry, its tendency to persist.


Figures

FIG. 1.
FIG. 1.
BFA treatment causes intracellular accumulation of infectious HCV precursors. Persistently infected cells were treated with BFA (1 μg/ml) for 9 h at 37°C. Samples of the supernatants and cells were collected at the indicated time points, and intracellular and extracellular infectivity was determined in the absence (black bars) or presence (white bars) of BFA. (A) Extracellular infectivity (FFU/ml). (B) Intracellular infectivity (FFU/ml). (C) Persistently infected cells were treated with BFA (1 μg/ml) for a 6-h period, after which samples of supernatants were collected. Cells were washed once with PBS and further incubated for another 20 h with complete medium. Extracellular infectivity in supernatants after BFA treatment (black bars) and after drug removal (white bars) was determined by serial dilution and immunofluorescence, as described in Materials and Methods. (D) Intracellular infectivity was determined for lysates of the cells used in the experiment described for panel C. Results are presented as averages and standard deviations for triplicate experiments (n = 3).
FIG. 2.
FIG. 2.
Buoyant density of infectious particles accumulated within infected cells. The buoyant density profile of particles present in persistently infected cell cultures was determined by equilibrium ultracentrifugation of sucrose gradients. Cell lysates of persistently infected cells were prepared after 6 h of BFA (1 μg/ml) or ALLN (40 μM) treatment and were ultracentrifuged in an isopycnic sucrose gradient (20 to 60% sucrose) until equilibrium was reached. Fractions of the gradient were collected from the top, and infectivity was determined by serial dilution and immunofluorescence. The buoyant density profile is represented by the infectivity (FFU/ml) present in each fraction. The density (g/ml) of each fraction is shown as a dotted line.
FIG. 3.
FIG. 3.
Intracellular infectious HCV precursors are susceptible to nonproteasomal degradation. Persistently infected cells were treated with the proteasome inhibitors lactacystin, MG132, and ALLN (40 μM) at 37°C. (A) Inhibition of the proteasome was demonstrated by the accumulation of ubiquitinated proteins, as shown by Western blotting with anti-ubiquitin antibodies of total cell extracts obtained after a 16-h incubation period. Samples were analyzed for GAPDH content as a loading control. Molecular mass markers are shown in kilodaltons. (B) Intracellular infectivity (FFU/ml) was determined at 6 h posttreatment in the presence of lactacystin, MG132, ALLN (40 μM), or ALLN (40 μM) in combination with BFA (1 μg/ml). (C) Time course showing rapid intracellular infectious particle accumulation in the presence of ALLN (40 μM) (white bars) compared to that in the control (black bars). (D) Extracellular infectivity after treatment of persistently infected cells with 40 μM ALLN for 9 h at 37°C. Extracellular infectivity titers were determined in the presence (white bars) and absence (black bars) of the drug, as described in Materials and Methods, and are presented as averages and standard deviations for triplicate experiments (n = 3).
FIG. 4.
FIG. 4.
E64 and ALLN prevent post-ER degradation of intracellular precursors. Persistently infected cells were incubated with E64 (25 μg/ml) and ALLN (50 μM) for 6 h at 37°C. (A) Intracellular infectious particles accumulate in the presence of E64 and ALLN, and this accumulation can be prevented by simultaneous addition of MTPi (15 μM). (B) Intracellular infectious HCV accumulation in the presence of BFA (1 μg/ml) and E64 (25 μg/ml). (C) Extracellular infectivity in the supernatants of persistently infected cells treated with E64 (25 μg/ml) or ALLN (50 μM). Results are shown as means and standard deviations for triplicate experiments (n = 3).
FIG. 5.
FIG. 5.
Infectious HCV particle secretion inhibition by the MTP inhibitor BMS-200150. Persistently infected Huh-7 cells were treated with MTPi as described in Materials and Methods. (A) Accumulation of extracellular infectious particles was reduced in the presence of 10 μM MTPi (white bars) compared to that in cells treated with dimethyl sulfoxide (DMSO) (control) when infectivity in the supernatants was analyzed at the indicated times posttreatment. Results are shown as infectivity titers, in FFU/ml. (B) MTPi treatment (10 μM) similarly reduced both extracellular infectivity (black bars) and HCV RNA content (white bars) of infected cell supernatants collected at 8 h posttreatment, as determined by RT-qPCR. Results are shown as percentages of the control level. (C) Dose-dependent reduction of extracellular infectivity titers (black bars) in supernatants of infected cells treated with the indicated doses of MTPi collected at 8 h posttreatment. Human apoB (gray bars) and HCV core protein (hatched bars) levels were decreased proportionally, as evaluated by ELISA. Results are shown as percentages of the control level. (D) MTPi treatment did not alter either the intracellular infectious particle content (gray bars) or the intracellular level of HCV RNA (white bars), while it significantly reduced the supernatant infectivity titer (black bars). Results are shown as percentages of the control levels (DMSO). (E) Cells persistently infected with chimeric viruses bearing structural proteins corresponding to genotypes 1a (H77), 1b (Con1), and 2a (J6) were treated with MTPi (10 μM) for 9 h at 37°C. The infectivity titers after treatment were normalized to that of vehicle-treated (DMSO) cells. (F) Single-cycle infection in the presence of MTPi. Huh-7 cells were inoculated at an MOI of 5. At 5 hours postinoculation, the cells were washed once with PBS and treated with MTPi (10 μM) or vehicle (DMSO). Samples of the cells and their supernatants were collected at 24 h postinfection. Extra- and intracellular infectivity, as well as HCV RNA content, were determined as described in Materials and Methods. The results are expressed as inhibition of intracellular RNA accumulation, as determined by RT-qPCR (HCV RNA copies/μg), and intracellular and extracellular infectivity, as determined by titration (FFU/ml). Values are expressed as average levels of inhibition and standard deviations for triplicate infections (n = 3).
FIG. 6.
FIG. 6.
MTP inhibition results in reduced intracellular HCV infectious accumulation, not in increased intracellular infectious particle degradation. (A) Persistently infected cells were treated with BFA alone (1 μg/ml) or in combination with MTPi (10 μM) for 9 h at 37°C. (B) Cells were treated with ALLN alone (40 μM) or in combination with MTPi (10 μM) for 9 h at 37°C. Cells were collected at the indicated times posttreatment, and the infectivity titers of total cell lysates were determined as described in Materials and Methods. Results are presented as averages and standard deviations for triplicate experiments (n = 3) and are shown as infectivity titers, in FFU/ml.
FIG. 7.
FIG. 7.
Efficient HCV spread is impaired in cells expressing reduced apoB levels. apoB-deficient cells were infected at an MOI of 0.01 with JFH-1, and the infectivity in the cell supernatants was determined at different times postinfection. (A) apoB-deficient cells showed reduced apoB mRNA levels (black bars), as determined by RT-qPCR; reduced extracellular apoB levels (white bars), as determined by ELISA; and reduced HCV infectivity (gray bars) in the supernatants collected at day 7 postinfection. (B) Reduced cellular apoB levels lead to inefficient viral spread, as shown by the reduced numbers of infectious particles accumulated in the supernatant (FFU/ml) over time for cells expressing apoB shRNA-1 (white squares) and shRNA-3 (white triangles) compared to that for cells expressing GFP only (black diamonds). Results are presented as averages and standard deviations for duplicate experiments (n = 2). (C) apoB-deficient Huh-7 cells were infected at a low multiplicity (MOI of 0.01) with chimeric viruses expressing structural proteins from different genotypes. The reduced number of HCV core-positive cells at day 7 (JFH-1) or day 12 (J6, Con1, and H77) in apoB-deficient versus control cells suggests an inefficient viral spread in these cells, regardless of the genotype of the viral particles. (D) Infectivity titers at 7 days postinfection (FFU/ml) in the supernatants of cells infected at a low multiplicity reflect the reduced ability of cells expressing low apoB levels to produce infectious HCV particles from various HCV genotypes. Results are presented as percentages and are averages and standard deviations for triplicate experiments (n = 3).
FIG. 8.
FIG. 8.
Reduced apoB secretion reduces viral particle assembly and secretion without interfering with infection efficiency or HCV RNA replication. Cells expressing reduced apoB levels were infected at an MOI of 5 with a cell culture-adapted JFH-1 virus (see Materials and Methods). (A) Relative apoB mRNA quantitation by RT-qPCR shows a reduced expression of apoB in cells expressing specific shRNAs. Results are presented as percentages of the control level. (B) Infectivity titers determined at 24 h postinfection show a reduced accumulation of infectious HCV particles in the supernatant (black bars) as well as within infected cells (gray bars). This reduction was proportional to the level of secreted apoB (white bars). Results are presented as percentages of the control level. (C) Extracellular HCV RNA levels were also reduced in cells expressing the specific shRNA-1 (gray bars) and shRNA-3 (white bars) compared to that in the control cells (black bars), as determined by RT-qPCR. Results are shown as copy numbers/ml of supernatant. (D) Analysis of intracellular HCV RNA content by RT-qPCR revealed that there were no significant differences between control and shRNA-expressing cells at any time postinfection. Results are shown as copy numbers/μg of total cellular RNA. GE, genome equivalents. (E) Full-length JFH-1 replicon cells were transduced with lentiviral vectors expressing apoB shRNAs. The transduced cells were propagated, and HCV RNA as well as apoB mRNA levels were monitored by RT-qPCR. Results show HCV RNA levels when maximum apoB downregulation was observed (at 8 days posttransduction). (F) An identical experimental setup was used with cells bearing a subgenomic JFH-1 replicon. Results are presented as percentages and are averages and standard deviations for triplicate experiments (n = 3).

Similar articles

Cited by

References

    1. Adeli, K. 1994. Regulated intracellular degradation of apolipoprotein B in semipermeable HepG2 cells. J. Biol. Chem. 2699166-9175. - PubMed
    1. Agnello, V., G. Abel, M. Elfahal, G. B. Knight, and Q. X. Zhang. 1999. Hepatitis C virus and other Flaviviridae viruses enter cells via low density lipoprotein receptor. Proc. Natl. Acad. Sci. USA 9612766-12771. - PMC - PubMed
    1. Andre, P., F. Komurian-Pradel, S. Deforges, M. Perret, J. L. Berland, M. Sodoyer, S. Pol, C. Brechot, G. Paranhos-Baccala, and V. Lotteau. 2002. Characterization of low- and very-low-density hepatitis C virus RNA-containing particles. J. Virol. 766919-6928. - PMC - PubMed
    1. Andre, P., G. Perlemuter, A. Budkowska, C. Brechot, and V. Lotteau. 2005. Hepatitis C virus particles and lipoprotein metabolism. Semin. Liver Dis. 2593-104. - PubMed
    1. Bartosch, B., A. Vitelli, C. Granier, C. Goujon, J. Dubuisson, S. Pascale, E. Scarselli, R. Cortese, A. Nicosia, and F. L. Cosset. 2003. Cell entry of hepatitis C virus requires a set of co-receptors that include the CD81 tetraspanin and the SR-B1 scavenger receptor. J. Biol. Chem. 27841624-41630. - PubMed

Publication types

LinkOut - more resources