Mechanisms for segregating T cell receptor and adhesion molecules during immunological synapse formation in Jurkat T cells
- PMID: 18077330
- PMCID: PMC2154425
- DOI: 10.1073/pnas.0710258105
Mechanisms for segregating T cell receptor and adhesion molecules during immunological synapse formation in Jurkat T cells
Abstract
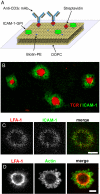
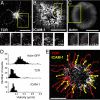
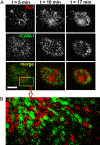
T cells interacting with antigen-presenting cells (APCs) form an "immunological synapse" (IS), a bull's-eye pattern composed of a central supramolecular activation cluster enriched with T cell receptors (TCRs) surrounded by a ring of adhesion molecules (a peripheral supramolecular activation cluster). The mechanism responsible for segregating TCR and adhesion molecules remains poorly understood. Here, we show that immortalized Jurkat T cells interacting with a planar lipid bilayer (mimicking an APC) will form an IS, thereby providing an accessible model system for studying the cell biological processes underlying IS formation. We found that an actin-dependent process caused TCR and adhesion proteins to cluster at the cell periphery, but these molecules appeared to segregate from one another at the earliest stages of microdomain formation. The TCR and adhesion microdomains attached to actin and were carried centripetally by retrograde flow. However, only the TCR microdomains penetrated into the actin-depleted cell center, whereas the adhesion microdomains appeared to be unstable without an underlying actin cytoskeleton. Our results reveal that TCR and adhesion molecules spatially partition from one another well before the formation of a mature IS and that differential actin interactions help to shape and maintain the final bull's-eye pattern of the IS.
Conflict of interest statement
The authors declare no conflict of interest.
Figures


Similar articles
-
T Cells on Engineered Substrates: The Impact of TCR Clustering Is Enhanced by LFA-1 Engagement.Front Immunol. 2018 Sep 18;9:2085. doi: 10.3389/fimmu.2018.02085. eCollection 2018. Front Immunol. 2018. PMID: 30279692 Free PMC article.
-
The immunological synapse: a cause or consequence of T-cell receptor triggering?Immunology. 2011 Aug;133(4):420-5. doi: 10.1111/j.1365-2567.2011.03458.x. Epub 2011 Jun 2. Immunology. 2011. PMID: 21631496 Free PMC article. Review.
-
Polarized release of T-cell-receptor-enriched microvesicles at the immunological synapse.Nature. 2014 Mar 6;507(7490):118-23. doi: 10.1038/nature12951. Epub 2014 Feb 2. Nature. 2014. PMID: 24487619 Free PMC article.
-
IGSF4 is a novel TCR ζ-chain-interacting protein that enhances TCR-mediated signaling.J Exp Med. 2011 Nov 21;208(12):2545-60. doi: 10.1084/jem.20110853. Epub 2011 Nov 14. J Exp Med. 2011. PMID: 22084409 Free PMC article.
-
Cytoskeletal polarization and redistribution of cell-surface molecules during T cell antigen recognition.Semin Immunol. 2000 Feb;12(1):5-21. doi: 10.1006/smim.2000.0203. Semin Immunol. 2000. PMID: 10723794 Review.
Cited by
-
Calcium influx through CRAC channels controls actin organization and dynamics at the immune synapse.Elife. 2016 Jul 21;5:e14850. doi: 10.7554/eLife.14850. Elife. 2016. PMID: 27440222 Free PMC article.
-
Micro-adhesion rings surrounding TCR microclusters are essential for T cell activation.J Exp Med. 2016 Jul 25;213(8):1609-25. doi: 10.1084/jem.20151088. Epub 2016 Jun 27. J Exp Med. 2016. PMID: 27354546 Free PMC article.
-
T cell antigen receptor activation and actin cytoskeleton remodeling.Biochim Biophys Acta. 2014 Feb;1838(2):546-56. doi: 10.1016/j.bbamem.2013.05.004. Epub 2013 May 14. Biochim Biophys Acta. 2014. PMID: 23680625 Free PMC article. Review.
-
F-actin polymerization and retrograde flow drive sustained PLCγ1 signaling during T cell activation.J Cell Biol. 2012 Jun 11;197(6):775-87. doi: 10.1083/jcb.201201018. Epub 2012 Jun 4. J Cell Biol. 2012. PMID: 22665519 Free PMC article.
-
madSTORM: a superresolution technique for large-scale multiplexing at single-molecule accuracy.Mol Biol Cell. 2016 Nov 7;27(22):3591-3600. doi: 10.1091/mbc.E16-05-0330. Epub 2016 Oct 5. Mol Biol Cell. 2016. PMID: 27708141 Free PMC article.
References
-
- Monks CRF, Freiberg BA, Kupfer H, Sciaky N, Kupfer A. Nature. 1998;395:82–86. - PubMed
-
- Grakoui A, Bromley SK, Sumen C, Davis MM, Shaw AS, Allen PM, Dustin ML. Science. 1999;285:221–227. - PubMed
-
- Lee KH, Holdorf AD, Dustin ML, Chan AC, Allen PM, Shaw AS. Science. 2002;295:1539–1542. - PubMed
-
- Freiberg BA, Kupfer H, Maslanik W, Delli J, Kappler J, Zaller DM, Kupfer A. Nat Immunol. 2002;3:911–917. - PubMed
-
- Lee KH, Dinner AR, Tu C, Campi G, Raychaudhuri S, Varma R, Sims TN, Burack WR, Wu H, Wang J, et al. Science. 2003;302:1218–1222. - PubMed
Publication types
MeSH terms
Substances
LinkOut - more resources
Full Text Sources
Other Literature Sources
Miscellaneous

