Loss of macroautophagy promotes or prevents fibroblast apoptosis depending on the death stimulus
- PMID: 18073215
- PMCID: PMC2754125
- DOI: 10.1074/jbc.M706666200
Loss of macroautophagy promotes or prevents fibroblast apoptosis depending on the death stimulus
Abstract
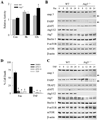
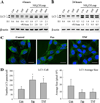
Macroautophagy has been implicated as a mechanism of cell death. However, the relationship between this degradative pathway and cell death is unclear as macroautophagy has been shown recently to protect against apoptosis. To better define the interplay between these two critical cellular processes, we determined whether inhibition of macroautophagy could have both pro-apoptotic and anti-apoptotic effects in the same cell. Embryonic fibroblasts from mice with a knock-out of the essential macroautophagy gene atg5 were treated with activators of the extrinsic and intrinsic death pathways. Loss of macroautophagy sensitized these cells to caspase-dependent apoptosis from the death receptor ligands Fas and tumor necrosis factor-alpha (TNF-alpha). Atg5-/- mouse embryonic fibroblasts had increased activation of the mitochondrial death pathway in response to Fas/TNF-alpha in concert with decreased ATP levels. Fas/TNF-alpha treatment failed to up-regulate macroautophagy, and in fact, decreased activity at late time points. In contrast to their sensitization to Fas/TNF-alpha, Atg5-/- cells were resistant to death from menadione and UV light. In the absence of macroautophagy, an up-regulation of chaperone-mediated autophagy induced resistance to these stressors. These results demonstrate that inhibition of macroautophagy can promote or prevent apoptosis in the same cell and that the response is governed by the nature of the death stimulus and compensatory changes in other forms of autophagy. Experimental findings that an inhibition of macroautophagy blocks apoptosis do not prove that autophagy mediates cell death as this effect may result from the protective up-regulation of other autophagic pathways such as chaperone-mediated autophagy.
Figures


Similar articles
-
Compensatory mechanisms and the type of injury determine the fate of cells with impaired macroautophagy.Autophagy. 2008 May;4(4):516-8. doi: 10.4161/auto.5800. Epub 2008 Feb 27. Autophagy. 2008. PMID: 18319638
-
Macroautophagy and chaperone-mediated autophagy are required for hepatocyte resistance to oxidant stress.Hepatology. 2010 Jul;52(1):266-77. doi: 10.1002/hep.23645. Hepatology. 2010. PMID: 20578144 Free PMC article.
-
FADD-deficient mouse embryonic fibroblasts undergo RIPK1-dependent apoptosis and autophagy after NB-UVB irradiation.J Photochem Photobiol B. 2019 May;194:32-45. doi: 10.1016/j.jphotobiol.2019.03.007. Epub 2019 Mar 14. J Photochem Photobiol B. 2019. PMID: 30904584
-
Molecular mechanism of ultraviolet-induced keratinocyte apoptosis.J Interferon Cytokine Res. 2000 May;20(5):445-54. doi: 10.1089/10799900050023852. J Interferon Cytokine Res. 2000. PMID: 10841072 Review.
-
Caspase involvement in autophagy.Cell Death Differ. 2017 Aug;24(8):1369-1379. doi: 10.1038/cdd.2017.43. Epub 2017 Jun 2. Cell Death Differ. 2017. PMID: 28574508 Free PMC article. Review.
Cited by
-
Altered metabolism by autophagy defection affect liver regeneration.PLoS One. 2021 Apr 29;16(4):e0250578. doi: 10.1371/journal.pone.0250578. eCollection 2021. PLoS One. 2021. PMID: 33914811 Free PMC article.
-
Autophagy and apoptosis in liver injury.Cell Cycle. 2015;14(11):1631-42. doi: 10.1080/15384101.2015.1038685. Cell Cycle. 2015. PMID: 25927598 Free PMC article. Review.
-
The regulation, function, and role of lipophagy, a form of selective autophagy, in metabolic disorders.Cell Death Dis. 2022 Feb 8;13(2):132. doi: 10.1038/s41419-022-04593-3. Cell Death Dis. 2022. PMID: 35136038 Free PMC article. Review.
-
Autophagy in health and disease. 2. Regulation of lipid metabolism and storage by autophagy: pathophysiological implications.Am J Physiol Cell Physiol. 2010 May;298(5):C973-8. doi: 10.1152/ajpcell.00527.2009. Epub 2010 Jan 20. Am J Physiol Cell Physiol. 2010. PMID: 20089934 Free PMC article. Review.
-
Functions of autophagy in hepatic and pancreatic physiology and disease.Gastroenterology. 2011 Jun;140(7):1895-908. doi: 10.1053/j.gastro.2011.04.038. Epub 2011 Apr 23. Gastroenterology. 2011. PMID: 21530520 Free PMC article. Review.
References
Publication types
MeSH terms
Substances
Grants and funding
- R01 DK044234/DK/NIDDK NIH HHS/United States
- R01 AG021904-06/AG/NIA NIH HHS/United States
- P01 DK041918-16/DK/NIDDK NIH HHS/United States
- P01 DK041918/DK/NIDDK NIH HHS/United States
- P01 DK041918-17/DK/NIDDK NIH HHS/United States
- R37 AG021904/AG/NIA NIH HHS/United States
- R56 DK044234/DK/NIDDK NIH HHS/United States
- R01 AG021904-07/AG/NIA NIH HHS/United States
- R01 DK044234-15/DK/NIDDK NIH HHS/United States
- T32AG023475/AG/NIA NIH HHS/United States
- DK044234/DK/NIDDK NIH HHS/United States
- AG021904/AG/NIA NIH HHS/United States
- R01 AG021904/AG/NIA NIH HHS/United States
- DK041918/DK/NIDDK NIH HHS/United States
- T32 AG023475/AG/NIA NIH HHS/United States
- R01 DK044234-16/DK/NIDDK NIH HHS/United States
LinkOut - more resources
Full Text Sources
Other Literature Sources
Research Materials
Miscellaneous

