A modular network model of aging
- PMID: 18059442
- PMCID: PMC2174624
- DOI: 10.1038/msb4100189
A modular network model of aging
Abstract
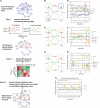
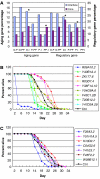
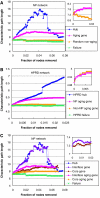
Many fundamental questions on aging are still unanswered or are under intense debate. These questions are frequently not addressable by examining a single gene or a single pathway, but can best be addressed at the systems level. Here we examined the modular structure of the protein-protein interaction (PPI) networks during fruitfly and human brain aging. In both networks, there are two modules associated with the cellular proliferation to differentiation temporal switch that display opposite aging-related changes in expression. During fly aging, another couple of modules are associated with the oxidative-reductive metabolic temporal switch. These network modules and their relationships demonstrate (1) that aging is largely associated with a small number, instead of many network modules, (2) that some modular changes might be reversible and (3) that genes connecting different modules through PPIs are more likely to affect aging/longevity, a conclusion that is experimentally validated by Caenorhabditis elegans lifespan analysis. Network simulations further suggest that aging might preferentially attack key regulatory nodes that are important for the network stability, implicating a potential molecular basis for the stochastic nature of aging.
Figures


Similar articles
-
Predicting aging/longevity-related genes in the nematode Caenorhabditis elegans.Chem Biodivers. 2007 Nov;4(11):2639-55. doi: 10.1002/cbdv.200790216. Chem Biodivers. 2007. PMID: 18027377
-
RNAi screens to identify components of gene networks that modulate aging in Caenorhabditis elegans.Brief Funct Genomics. 2010 Jan;9(1):53-64. doi: 10.1093/bfgp/elp051. Epub 2010 Jan 6. Brief Funct Genomics. 2010. PMID: 20053814 Free PMC article. Review.
-
RNA surveillance-an emerging role for RNA regulatory networks in aging.Ageing Res Rev. 2011 Apr;10(2):216-24. doi: 10.1016/j.arr.2010.02.002. Epub 2010 Feb 17. Ageing Res Rev. 2011. PMID: 20170753 Free PMC article. Review.
-
Inferring the functions of longevity genes with modular subnetwork biomarkers of Caenorhabditis elegans aging.Genome Biol. 2010;11(2):R13. doi: 10.1186/gb-2010-11-2-r13. Epub 2010 Feb 3. Genome Biol. 2010. PMID: 20128910 Free PMC article.
-
A Systems Approach to Reverse Engineer Lifespan Extension by Dietary Restriction.Cell Metab. 2016 Mar 8;23(3):529-40. doi: 10.1016/j.cmet.2016.02.002. Cell Metab. 2016. PMID: 26959186 Free PMC article.
Cited by
-
LIN-28 balances longevity and germline stem cell number in Caenorhabditis elegans through let-7/AKT/DAF-16 axis.Aging Cell. 2017 Feb;16(1):113-124. doi: 10.1111/acel.12539. Epub 2016 Oct 11. Aging Cell. 2017. PMID: 27730721 Free PMC article.
-
Robustness during Aging-Molecular Biological and Physiological Aspects.Cells. 2020 Aug 8;9(8):1862. doi: 10.3390/cells9081862. Cells. 2020. PMID: 32784503 Free PMC article. Review.
-
Lithocholic acid extends longevity of chronologically aging yeast only if added at certain critical periods of their lifespan.Cell Cycle. 2012 Sep 15;11(18):3443-62. doi: 10.4161/cc.21754. Epub 2012 Aug 16. Cell Cycle. 2012. PMID: 22894934 Free PMC article.
-
Systems-level analysis of human aging genes shed new light on mechanisms of aging.Hum Mol Genet. 2016 Jul 15;25(14):2934-2947. doi: 10.1093/hmg/ddw145. Epub 2016 May 14. Hum Mol Genet. 2016. PMID: 27179790 Free PMC article.
-
Serotonin signaling modulates aging-associated metabolic network integrity in response to nutrient choice in Drosophila melanogaster.Commun Biol. 2021 Jun 15;4(1):740. doi: 10.1038/s42003-021-02260-5. Commun Biol. 2021. PMID: 34131274 Free PMC article.
References
-
- Albert R, Jeong H, Barabasi AL (2000) Error and attack tolerance of complex networks. Nature 406: 378–382 - PubMed
-
- Ashburner M, Ball CA, Blake JA, Botstein D, Butler H, Cherry JM, Davis AP, Dolinski K, Dwight SS, Eppig JT, Harris MA, Hill DP, Issel-Tarver L, Kasarskis A, Lewis S, Matese JC, Richardson JE, Ringwald M, Rubin GM, Sherlock G (2000) Gene ontology: tool for the unification of biology. The Gene Ontology Consortium. Nat Genet 25: 25–29 - PMC - PubMed
-
- Finch CE (1990) Longevity, Senescence, and the Genome. Chicago: University of Chicago Press
Publication types
MeSH terms
LinkOut - more resources
Full Text Sources
Medical
Molecular Biology Databases

