. 2008 Feb;82(3):1474-83.
doi: 10.1128/JVI.01650-07. Epub 2007 Dec 5.

Negative feedback regulation of RIG-I-mediated antiviral signaling by interferon-induced ISG15 conjugation

Affiliations

Negative feedback regulation of RIG-I-mediated antiviral signaling by interferon-induced ISG15 conjugation

Min-Jung Kim et al. J Virol. 2008 Feb.

Abstract

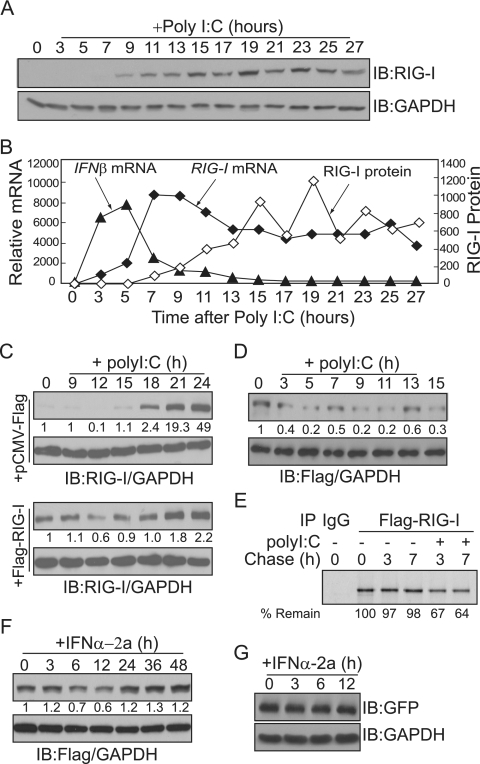
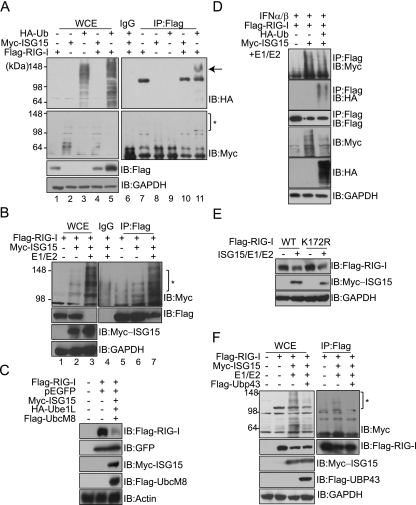
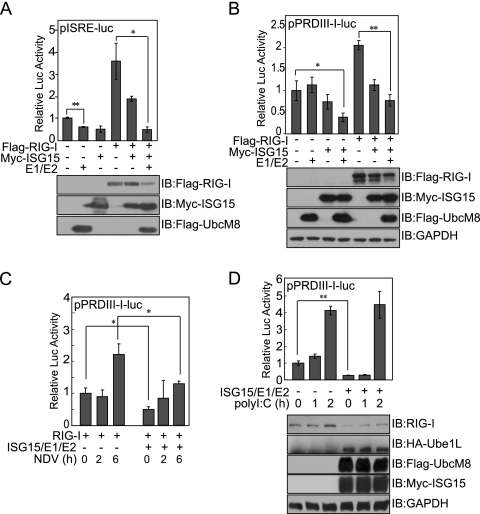
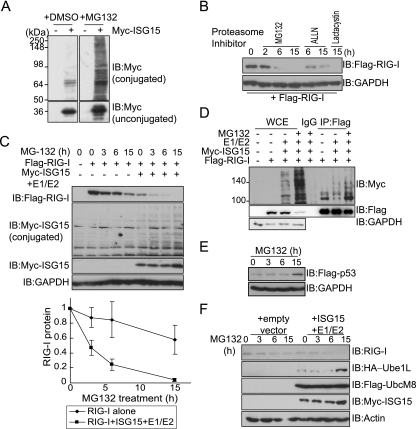
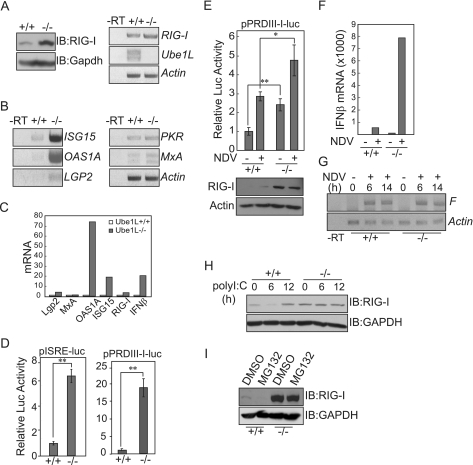
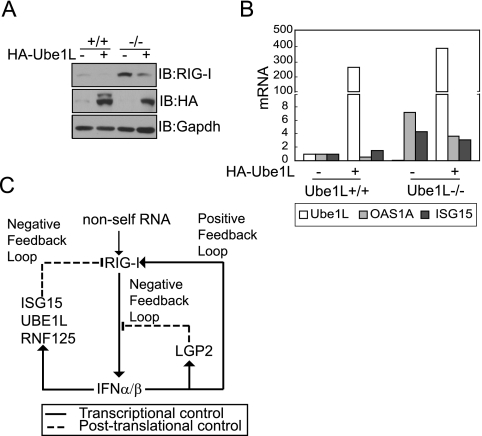
RIG-I senses intracellular virus-specific nucleic acid structures and initiates an antiviral response that induces interferon (IFN) production, which, in turn, activates the transcription of RIG-I to increase RIG-I protein levels. Upon intracellular poly(I:C) stimulation, however, the levels of RIG-I protein did not correlate with the expression patterns of RIG-I transcripts. When the ISG15 conjugation system was overexpressed, ISG15 was conjugated to RIG-I and cellular levels of the unconjugated form of RIG-I decreased. The ISGylation of RIG-I reduced levels of both basal and virus-induced IFN promoter activity. Levels of unconjugated RIG-I also decreased when 26S proteasome activity was blocked by treatment with MG132, ALLN, or Lactacystin. In the presence of MG132, ISG15 conjugation to RIG-I increased, and hence, the unconjugated form of RIG-I was reduced. In Ube1L(-/-) cells, which lack the ability to conjugate ISG15, basal levels of both RIG-I protein and transcripts were increased compared to those in wild-type cells. As a result, enhanced production of ISGs and enhanced IFN promoter activity in Ube1L(-/-) cells were observed, and the phenotype was restored to that of wild-type cells by the overexpression of Ube1L. Based on these results, we propose a novel negative feedback loop which adjusts the strength of the RIG-I-mediated antiviral response and IFN production through the regulation of RIG-I protein by IFN-induced ISG15 conjugation.


Figures

FIG. 1.
FIG. 1.
Cellular levels of RIG-I protein oscillate in response to intracellular poly(I:C). (A) HepG2 cells were harvested at the indicated times after transfection with 10 μg of poly(I:C)/ml, and total cell extracts were probed with antibodies against RIG-I protein and GAPDH. Levels of RIG-I protein were quantified by measuring the immunoblot (IB) band intensity using ImageJ (NIH) and normalized to GAPDH protein levels. A line representing the degree of induction (n-fold) of RIG-I protein, compared to the protein level in untreated cells (time zero), is superimposed over the line representing RIG-I transcript levels in panel B. (B) Total RNA was isolated from HepG2 cells at the indicated times after transfection with 10 μg of poly(I:C)/ml. RIG-I and IFN-β transcripts were quantified by real-time RT-PCR, and the results were normalized to levels of β-actin gene transcripts. The degree of induction (n-fold) compared to the level in untreated cells (time zero) is shown. Duplicate sets of cells were treated at the same time for panels A and B. (C) HepG2 cells were transiently transfected with empty or Flag-RIG-I expression vectors and harvested at the indicated times after transfection with 10 μg of poly(I:C)/ml. Total cell extracts were probed with antibodies to RIG-I protein (top panel) and GAPDH (bottom panel). Relative amounts of RIG-I protein are shown below the RIG-I immunoblot. The experiment was repeated twice, with similar results. (D and F) HEK293 cells stably expressing Flag-RIG-I were stimulated with 10 μg of poly(I:C)/ml (D) or 1,000 U of IFN-α2a/ml (F) for the indicated times. Levels of exogenous Flag-RIG-I protein were quantified with antibodies against Flag (top panels) and GAPDH (bottom panels). (E) Pulse-chase analysis of Flag-RIG-I. Cells were metabolically labeled with [35S]methionine for 90 min. For poly(I:C) stimulation, cells were transfected with poly(I:C) at the beginning of the chase. Cells were harvested at the chase end points, and RIG-I protein was immunoprecipitated (IP) with Flag antibody. Percentages of remaining RIG-I protein relative to the amount at time zero (100%) are shown at the bottom. −, absent; +, present. (G) HEK293 cells stably expressing Flag-RIG-I were transfected with pCMV-GFP. After 24 h, cells were stimulated with 1,000 U of IFN-α2a/ml for the indicated times. Levels of GFP were analyzed with antibodies against GFP (top panel) and GAPDH (bottom panel).
FIG. 2.
FIG. 2.
Cellular levels of RIG-I protein are decreased by ISG15 conjugation. (A) COS-7 cells were transfected with the indicated plasmids. Cells were harvested at 48 h posttransfection and subjected to immunoprecipitation (IP) with anti-Flag (lanes 7 to 11) or with mouse IgG (lane 6), followed by immunoblotting (IB) with anti-HA (top panel) or anti-Myc (bottom panel). The arrow and asterisk indicate the ubiquitinylated and ISGylated forms of RIG-I protein, respectively. Lanes 1 to 5, whole-cell extracts (WCE). −, absent; +, present. (B) COS-7 cells were transfected with 1 μg each of E1/E2, HA-Ube1L, and Flag-UbcM8 expression vectors, as indicated. To make the total amounts (4 μg/transfection) of plasmids for transfection equal under every condition, cells were cotransfected accordingly with empty vector. Total cell extracts were analyzed by immunoprecipitation with anti-Flag or with mouse IgG, followed by immunoblotting with anti-Myc, anti-Flag, or anti-GAPDH. The asterisk indicates the ISGylated form of RIG-I protein. The experiment was repeated at least three times, with similar results. (C) COS-7 cells were transfected with the indicated expression vectors. At 48 h posttransfection, total cell extracts were subjected to immunoblotting with anti-Flag, anti-GFP, anti-Myc, or antiactin. (D) COS-7 cells were transfected with the indicated plasmids. At 36 h posttransfection, cells were stimulated with IFN-α2a (1,000 U) for 12 h. Cells were harvested and subjected to immunoprecipitation with anti-Flag, followed by immunoblotting with the appropriate antibodies. (E) COS-7 cells were transfected with expression constructs, as indicated, harvested at 48 h posttransfection, and analyzed by immunoblotting with anti-Myc and anti-Flag. WT, wild type. (F) COS-7 cells were transfected with the indicated plasmids. At 48 h posttransfection, cells were harvested and subjected to immunoprecipitation with anti-Flag, followed by immunoblotting with the appropriate antibodies.
FIG. 3.
FIG. 3.
Overexpression of the ISG15 conjugating system negatively affects RIG-I-mediated IFN signaling. (A and B) COS-7 cells were cotransfected with the indicated expression vectors and pISRE-luc (A) or pPRDIII-I-luc (B). Cells were harvested at 48 h posttransfection and analyzed using a dual luciferase assay. The values shown are the means of results for triplicate samples, and the standard deviation (SD) is indicated. Representative results from one of three independent experiments are shown. IB, immunoblot; −, absent; +, present. (C) COS-7 cells were cotransfected with pPRDIII-I-luc and the indicated expression vectors. Cells were infected with NDV 42 h posttransfection, and luciferase activity was measured at the indicated times after infection. (D) HepG2 cells were transiently transfected with pPRDIII-I-luc and the indicated expression vectors. At 48 h posttransfection, cells were transfected with poly(I:C) for the indicated times. Total cell extracts were assayed for luciferase activity and probed with anti-RIG-I protein to examine endogenous levels of RIG-I protein. Student's t test: *, P < 0.05; **, P < 0.01.
FIG. 4.
FIG. 4.
Cellular levels of RIG-I protein decrease in response to treatment with proteasome inhibitors. (A) COS-7 cells were transfected with a Myc-ISG15 expression plasmid and treated with dimethyl sulfoxide (DMSO) or 10 μM MG132 for 15 h. Total cellular levels of ISG15-conjugated proteins (upper panels) or unconjugated free ISG15 (lower panels) were visualized by immunoblotting (IB) using anti-Myc. −, absent; +, present. (B) COS-7 cells were transfected with a Flag-RIG-I expression plasmid. At 36 h posttransfection, cells were treated with MG132 (10 μM), ALLN (10 μM), or Lactacystin (5 μM) for the indicated times, harvested, and analyzed by immmunoblotting with anti-Flag or anti-GAPDH. (C) COS-7 cells were transfected with a Flag-RIG-I expression plasmid alone or together with expression vectors for components of the ISG15 conjugating system. At 36 h posttransfection, cells were treated with 10 μM MG132 for the indicated times. Immunoblotting was performed using the indicated anti-Myc and anti-Flag antibodies. For loading control analysis, the membrane was stripped and reprobed with anti-GAPDH antibody. (Bottom panel) Cellular levels of remaining RIG-I protein following MG132 treatment. Levels of RIG-I protein were quantified by measuring the immunoblot band intensity using ImageJ (NIH) and normalized to GAPDH protein levels. Percentages of remaining RIG-I protein relative to the level of RIG-I protein at time zero (100%) were calculated. Values are averages (±SD) of results from three independent experiments. (D) COS-7 cells were transfected with various expression vectors, as indicated. Total cell extracts were subjected to immunoprecipitation (IP) with anti-Flag or with mouse IgG, followed by immunoblotting with anti-Myc, anti-Flag, or anti-GAPDH. WCE, whole-cell extracts. (E) HepG2 cells were transfected with Flag-p53 expression plasmid. After 36 h, cells were treated with 10 μM MG132 for the indicated times. Total cell extracts were harvested at the end of the incubations, and immunoblotting was performed using anti-Flag antibody. (F) HepG2 cells were transfected with the indicated plasmids and, at 36 h posttransfection, were treated with 10 μM MG132 for the indicated times. Total cell extracts were harvested at the end of the incubations, and immunoblotting was performed using the indicated antibodies.
FIG. 5.
FIG. 5.
The RIG-I-mediated antiviral signaling response is enhanced in UbelL-deficient MEFs. (A) Ube1L+/+ and Ube1L−/− MEF cells were analyzed for RIG-I expression. (Left panel) Immunoblot (IB) assay with anti-RIG-I protein and anti-GAPDH. (Right panel) RT-PCR analysis to measure RIG-I, UbelL, and β-actin gene transcripts. −RT, without reverse transcriptase. (B and C) Ube1L+/+ and Ube1L−/− MEF cells were analyzed for IFN-stimulated gene expression. Total RNA was extracted from MEF cells, and levels of ISG15, OAS1A, MxA, PKR, and Lgp2 gene transcripts were measured by conventional (B) or real-time (C) RT-PCR. The degree of induction (n-fold) of each transcript compared to the level in wild-type cells is shown. (D) Ube1L+/+ and Ube1L−/− MEF cells were analyzed for basal IRF activity. MEFs were transfected with the pISRE-luc or pPRDIII-I-luc reporter plasmid, and total extracts were assayed for luciferase activity. Representative results from one of three independent experiments are shown. Error bars indicate SDs for the three experiments. (E) Ube1L+/+ and Ube1L−/− MEF cells were analyzed for virus-induced IFN promoter activity. At 45 h posttransfection, MEFs were infected with NDV for 3 h and total extracts were assayed for IFN promoter activity. Error bars indicate SDs for results from three experiments. Student's t test: *, P < 0.05; **, P < 0.01. (F) Ube1L+/+ and Ube1L−/− MEF cells were analyzed for IFN-β transcripts. MEFs were infected with NDV for 3 h, and IFN-β transcripts were quantified by real-time RT-PCR. (G) Ube1L+/+ and Ube1L−/− MEF cells were analyzed for the levels of NDV replication. MEFs were infected with NDV for 6 or 14 h, and transcripts of the F gene were analyzed by RT-PCR. (H) MEFs were transfected with poly(I:C) for the indicated times, and total extracts were immunoassayed for endogenous RIG-I protein. (I) Ube1L+/+ and Ube1L−/− MEF cells were treated with 10 μM MG132 for 12 h, and levels of endogenous RIG-I protein were analyzed by immunoblotting. DMSO, dimethyl sulfoxide.
FIG. 6.
FIG. 6.
Overexpression of Ube1L restored the wild-type phenotype to Ube1L−/− MEFs. (A) Ube1L+/+ and Ube1L−/− MEF cells were transfected with an HA-Ube1L expression plasmid. After 48 h, total extracts were immunoassayed for endogenous RIG-I protein and HA-Ube1L expression. The experiment was repeated more than three times, with similar results. IB, immunoblot; −, absent; +, present. (B) Ube1L+/+ and Ube1L−/− MEF cells were transfected with an HA-Ube1L expression plasmid. After 48 h, levels of ISG15, OAS1A, and Ube1L gene transcripts were quantified by real-time RT-PCR. The degree of induction (n-fold) compared to the level in untreated wild-type MEFs is shown. (C) Proposed RIG-I signaling pathway regulated by multiple positive and negative feedback loops.

Similar articles

Cited by

References

    1. Akira, S., and K. Takeda. 2004. Toll-like receptor signalling. Nat. Rev. Immunol. 4499-511. - PubMed
    1. Akira, S., S. Uematsu, and O. Takeuchi. 2006. Pathogen recognition and innate immunity. Cell 124783-801. - PubMed
    1. Andrejeva, J., K. S. Childs, D. F. Young, T. S. Carlos, N. Stock, S. Goodbourn, and R. E. Randall. 2004. The V proteins of paramyxoviruses bind the IFN-inducible RNA helicase, mda-5, and inhibit its activation of the IFN-beta promoter. Proc. Natl. Acad. Sci. USA 10117264-17269. - PMC - PubMed
    1. Arimoto, K., H. Takahashi, T. Hishiki, H. Konishi, T. Fujita, and K. Shimotohno. 2007. Negative regulation of the RIG-I signaling by the ubiquitin ligase RNF125. Proc. Natl. Acad. Sci. USA 1047500-7505. - PMC - PubMed
    1. Blomstrom, D. C., D. Fahey, R. Kutny, B. D. Korant, and E. Knight, Jr. 1986. Molecular characterization of the interferon-induced 15-kDa protein. Molecular cloning and nucleotide and amino acid sequence. J. Biol. Chem. 2618811-8816. - PubMed

Publication types