

Bronchial smooth muscle remodeling involves calcium-dependent enhanced mitochondrial biogenesis in asthma
- PMID: 18056286
- PMCID: PMC2150973
- DOI: 10.1084/jem.20070956
Bronchial smooth muscle remodeling involves calcium-dependent enhanced mitochondrial biogenesis in asthma
Abstract
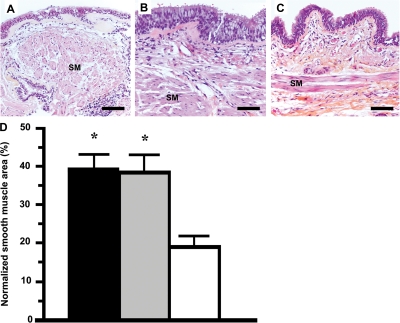
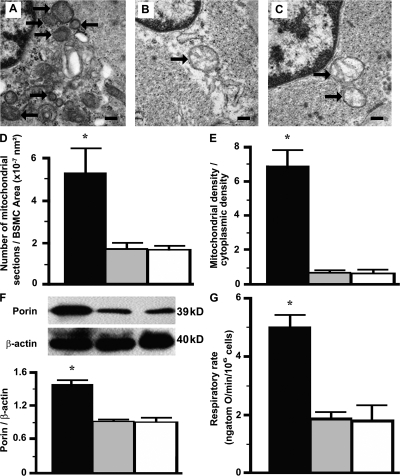
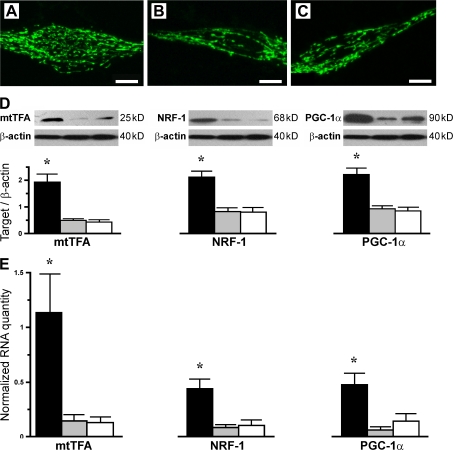
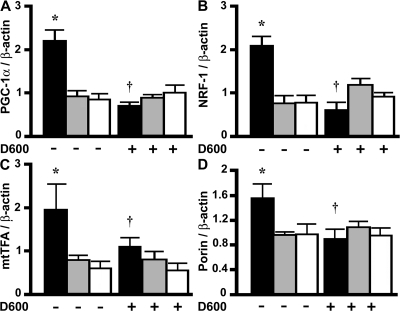
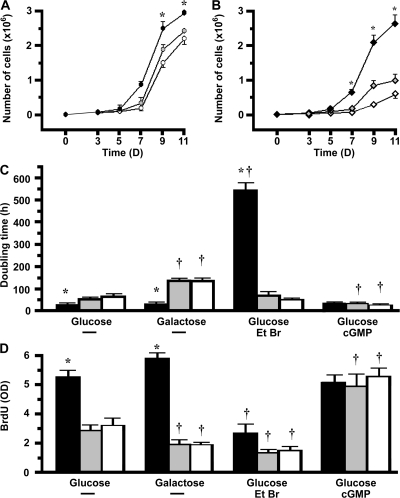
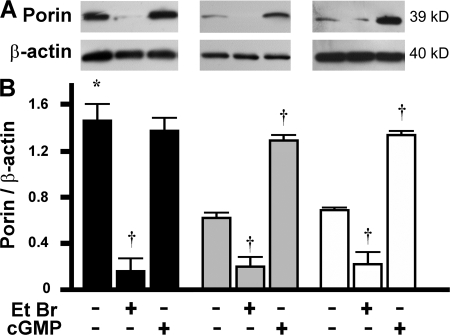
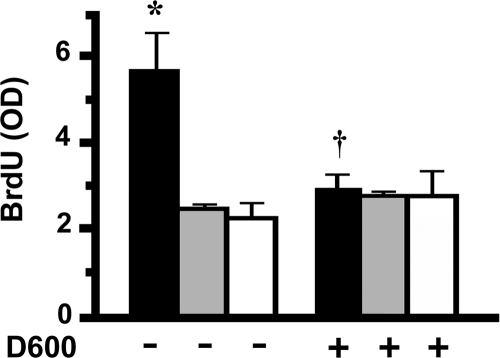
Asthma and chronic obstructive pulmonary disease (COPD) are characterized by different patterns of airway remodeling, which all include an increased mass of bronchial smooth muscle (BSM). A remaining major question concerns the mechanisms underlying such a remodeling of BSM. Because mitochondria play a major role in both cell proliferation and apoptosis, we hypothesized that mitochondrial activation in BSM could play a role in this remodeling. We describe that both the mitochondrial mass and oxygen consumption were higher in the BSM from asthmatic subjects than in that from both COPD and controls. This feature, which is specific to asthma, was related to an enhanced mitochondrial biogenesis through up-regulation of peroxisome proliferator-activated receptor gamma coactivator (PGC)-1alpha, nuclear respiratory factor-1, and mitochondrial transcription factor A. The priming event of such activation was an alteration in BSM calcium homeostasis. BSM cell apoptosis was not different in the three groups of subjects. Asthmatic BSM was, however, characterized by increased cell growth and proliferation. Both characteristics were completely abrogated in mitochondria-deficient asthmatic BSM cells. Conversely, in both COPD and control BSM cells, induction of mitochondrial biogenesis reproduced these characteristics. Thus, BSM in asthmatic patients is characterized by an altered calcium homeostasis that increases mitochondrial biogenesis, which, in turn, enhances cell proliferation, leading to airway remodeling.
Figures

Similar articles
-
Selective dysfunction of p53 for mitochondrial biogenesis induces cellular proliferation in bronchial smooth muscle from asthmatic patients.J Allergy Clin Immunol. 2016 Jun;137(6):1717-1726.e13. doi: 10.1016/j.jaci.2015.10.031. Epub 2015 Dec 11. J Allergy Clin Immunol. 2016. PMID: 26688517
-
Mitochondria are involved in bronchial smooth muscle remodeling in severe preschool wheezers.J Allergy Clin Immunol. 2021 Aug;148(2):645-651.e11. doi: 10.1016/j.jaci.2021.03.027. Epub 2021 Apr 2. J Allergy Clin Immunol. 2021. PMID: 33819511 Clinical Trial.
-
Protease activated receptor-2 expression and function in asthmatic bronchial smooth muscle.PLoS One. 2014 Feb 13;9(2):e86945. doi: 10.1371/journal.pone.0086945. eCollection 2014. PLoS One. 2014. PMID: 24551046 Free PMC article.
-
[Bronchial smooth muscle mitochondria: A new target for asthma therapy?].Rev Mal Respir. 2020 Mar;37(3):201-204. doi: 10.1016/j.rmr.2020.02.004. Epub 2020 Mar 2. Rev Mal Respir. 2020. PMID: 32139106 Review. French.
-
Regulation of mitochondrial biogenesis and PGC-1α under cellular stress.Mitochondrion. 2013 Mar;13(2):134-42. doi: 10.1016/j.mito.2013.01.006. Epub 2013 Jan 22. Mitochondrion. 2013. PMID: 23347985 Review.
Cited by
-
Airway smooth muscle inflammation is regulated by microRNA-145 in COPD.FEBS Lett. 2016 May;590(9):1324-34. doi: 10.1002/1873-3468.12168. Epub 2016 Apr 19. FEBS Lett. 2016. PMID: 27060571 Free PMC article.
-
Counterpoint: alterations in airway smooth muscle phenotype do not cause airway hyperresponsiveness in asthma.J Appl Physiol (1985). 2012 Sep 1;113(5):839-42. doi: 10.1152/japplphysiol.00483.2012a. J Appl Physiol (1985). 2012. PMID: 22942220 Free PMC article. No abstract available.
-
Mitochondrial biology in airway pathogenesis and the role of NRF2.Arch Pharm Res. 2020 Mar;43(3):297-320. doi: 10.1007/s12272-019-01182-5. Epub 2019 Sep 4. Arch Pharm Res. 2020. PMID: 31486024 Free PMC article. Review.
-
Itaconate Suppresses the Activation of Mitochondrial NLRP3 Inflammasome and Oxidative Stress in Allergic Airway Inflammation.Antioxidants (Basel). 2023 Feb 15;12(2):489. doi: 10.3390/antiox12020489. Antioxidants (Basel). 2023. PMID: 36830047 Free PMC article.
-
Moving mitochondria - Breathing new signaling into asthmatic airways.Redox Biol. 2018 Sep;18:244-245. doi: 10.1016/j.redox.2018.07.013. Epub 2018 Jul 21. Redox Biol. 2018. PMID: 30056272 Free PMC article. No abstract available.
References
-
- Busse, W.W., and R.F. Lemanske Jr. 2001. Asthma. N. Engl. J. Med. 344:350–362. - PubMed
-
- Pepe, C., S. Foley, J. Shannon, C. Lemiere, R. Olivenstein, P. Ernst, M.S. Ludwig, J.G. Martin, and Q. Hamid. 2005. Differences in airway remodeling between subjects with severe and moderate asthma. J. Allergy Clin. Immunol. 116:544–549. - PubMed
-
- Hogg, J.C., F. Chu, S. Utokaparch, R. Woods, W.M. Elliott, L. Buzatu, R.M. Cherniack, R.M. Rogers, F.C. Sciurba, H.O. Coxson, and P.D. Pare. 2004. The nature of small-airway obstruction in chronic obstructive pulmonary disease. N. Engl. J. Med. 350:2645–2653. - PubMed
-
- Lambert, R.K., B.R. Wiggs, K. Kuwano, J.C. Hogg, and P.D. Pare. 1993. Functional significance of increased airway smooth muscle in asthma and COPD. J. Appl. Physiol. 74:2771–2781. - PubMed
-
- Johnson, P.R., M. Roth, M. Tamm, M. Hughes, Q. Ge, G. King, J.K. Burgess, and J.L. Black. 2001. Airway smooth muscle cell proliferation is increased in asthma. Am. J. Respir. Crit. Care Med. 164:474–477. - PubMed
Publication types
MeSH terms
Substances
LinkOut - more resources
Full Text Sources
Other Literature Sources
Medical
