

Alzheimer's disease diagnosis in individual subjects using structural MR images: validation studies
- PMID: 18054253
- PMCID: PMC2390889
- DOI: 10.1016/j.neuroimage.2007.09.073
Alzheimer's disease diagnosis in individual subjects using structural MR images: validation studies
Abstract
Objective: To develop and validate a tool for Alzheimer's disease (AD) diagnosis in individual subjects using support vector machine (SVM)-based classification of structural MR (sMR) images.
Background: Libraries of sMR scans of clinically well characterized subjects can be harnessed for the purpose of diagnosing new incoming subjects.
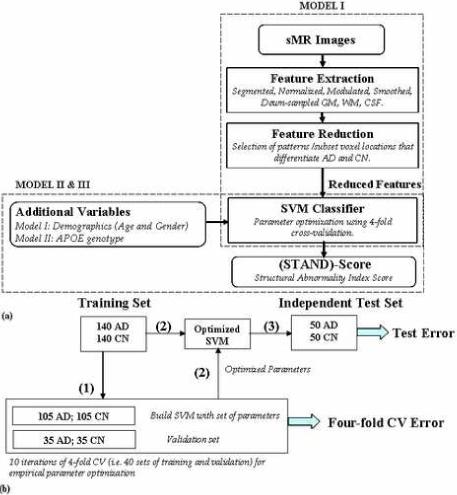
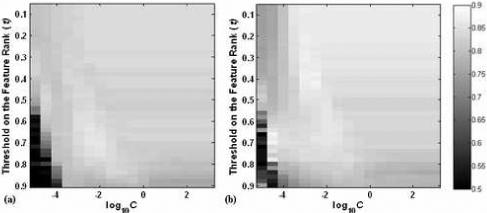
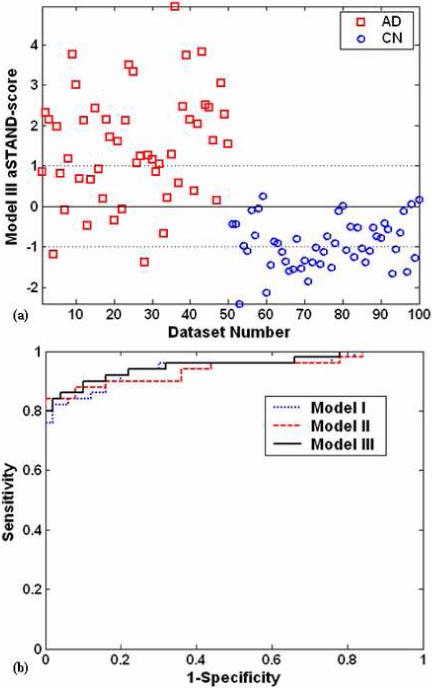
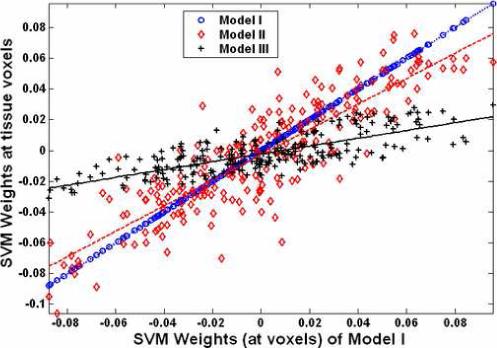
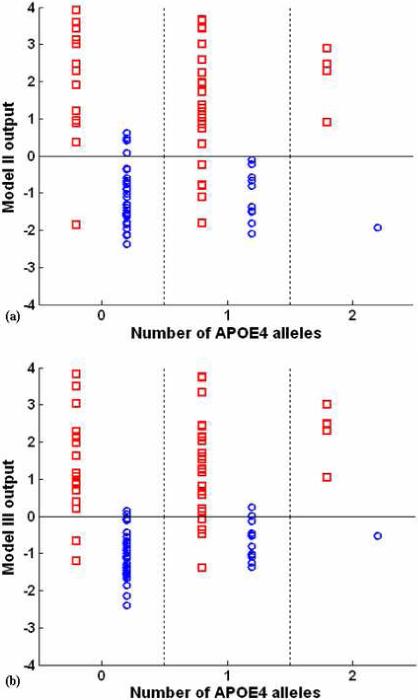
Methods: One hundred ninety patients with probable AD were age- and gender-matched with 190 cognitively normal (CN) subjects. Three different classification models were implemented: Model I uses tissue densities obtained from sMR scans to give STructural Abnormality iNDex (STAND)-score; and Models II and III use tissue densities as well as covariates (demographics and Apolipoprotein E genotype) to give adjusted-STAND (aSTAND)-score. Data from 140 AD and 140 CN were used for training. The SVM parameter optimization and training were done by four-fold cross validation (CV). The remaining independent sample of 50 AD and 50 CN was used to obtain a minimally biased estimate of the generalization error of the algorithm.
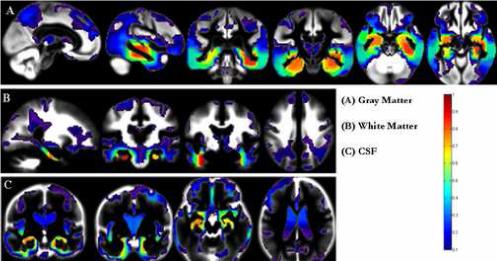
Results: The CV accuracy of Model II and Model III aSTAND-scores was 88.5% and 89.3%, respectively, and the developed models generalized well on the independent test data sets. Anatomic patterns best differentiating the groups were consistent with the known distribution of neurofibrillary AD pathology.
Conclusions: This paper presents preliminary evidence that application of SVM-based classification of an individual sMR scan relative to a library of scans can provide useful information in individual subjects for diagnosis of AD. Including demographic and genetic information in the classification algorithm slightly improves diagnostic accuracy.
Figures

Similar articles
-
Antemortem MRI based STructural Abnormality iNDex (STAND)-scores correlate with postmortem Braak neurofibrillary tangle stage.Neuroimage. 2008 Aug 15;42(2):559-67. doi: 10.1016/j.neuroimage.2008.05.012. Epub 2008 May 20. Neuroimage. 2008. PMID: 18572417 Free PMC article.
-
Automatic classification of MR scans in Alzheimer's disease.Brain. 2008 Mar;131(Pt 3):681-9. doi: 10.1093/brain/awm319. Epub 2008 Jan 17. Brain. 2008. PMID: 18202106 Free PMC article.
-
Local MRI analysis approach in the diagnosis of early and prodromal Alzheimer's disease.Neuroimage. 2011 Sep 15;58(2):469-80. doi: 10.1016/j.neuroimage.2011.05.083. Epub 2011 Jun 16. Neuroimage. 2011. PMID: 21718788
-
Effects of hardware heterogeneity on the performance of SVM Alzheimer's disease classifier.Neuroimage. 2011 Oct 1;58(3):785-92. doi: 10.1016/j.neuroimage.2011.06.029. Epub 2011 Jun 25. Neuroimage. 2011. PMID: 21708272 Free PMC article.
-
ApoE4 effects on automated diagnostic classifiers for mild cognitive impairment and Alzheimer's disease.Neuroimage Clin. 2014 Jan 4;4:461-72. doi: 10.1016/j.nicl.2013.12.012. eCollection 2014. Neuroimage Clin. 2014. PMID: 24634832 Free PMC article.
Cited by
-
Classification of structural MRI images in Alzheimer's disease from the perspective of ill-posed problems.PLoS One. 2012;7(10):e44877. doi: 10.1371/journal.pone.0044877. Epub 2012 Oct 10. PLoS One. 2012. PMID: 23071501 Free PMC article.
-
Hierarchical multi-class Alzheimer's disease diagnostic framework using imaging and clinical features.Front Aging Neurosci. 2022 Aug 10;14:935055. doi: 10.3389/fnagi.2022.935055. eCollection 2022. Front Aging Neurosci. 2022. PMID: 36034132 Free PMC article.
-
FDG PET and MRI in logopenic primary progressive aphasia versus dementia of the Alzheimer's type.PLoS One. 2013 Apr 23;8(4):e62471. doi: 10.1371/journal.pone.0062471. Print 2013. PLoS One. 2013. PMID: 23626825 Free PMC article.
-
Cerebral microbleeds: Prevalence and relationship to amyloid burden.Neurology. 2019 Jan 15;92(3):e253-e262. doi: 10.1212/WNL.0000000000006780. Epub 2018 Dec 19. Neurology. 2019. PMID: 30568001 Free PMC article.
-
Automatic Prediction of Conversion from Mild Cognitive Impairment to Probable Alzheimer's Disease using Structural Magnetic Resonance Imaging.AMIA Annu Symp Proc. 2010 Nov 13;2010:542-6. AMIA Annu Symp Proc. 2010. PMID: 21347037 Free PMC article.
References
-
- Alexander GE, Moeller JR. Application of the scaled subprofile model to functional imaging in neuropsychiatric disorders: a principal component approach to modeling regional patterns of brain function in disease. Human Brain Mapping. 1994;2:79–94.
-
- American Psychiatric Association . Diagnostic and statistical manual of mental disorders. 3rd rev edn American Psychiatric Press; Washington, D.C.: 1987.
-
- Ashburner J, Friston KJ. Voxel-based morphometry--the methods. Neuroimage. 2000;11:805–821. - PubMed
-
- Ashburner J, Friston KJ. Unified segmentation. Neuroimage. 2005;26:839–851. - PubMed
-
- Barnes J, Scahill RI, Boyes RG, Frost C, Lewis EB, Rossor CL, Rossor MN, Fox NC. Differentiating AD from aging using semiautomated measurement of hippocampal atrophy rates. Neuroimage. 2004;23:574–581. - PubMed
Publication types
MeSH terms
Substances
Grants and funding
- P50 AG16574/AG/NIA NIH HHS/United States
- R01 AG11378/AG/NIA NIH HHS/United States
- P50 AG016574/AG/NIA NIH HHS/United States
- KL2 RR024151/RR/NCRR NIH HHS/United States
- R01 AG011378-10/AG/NIA NIH HHS/United States
- R01 AG15866/AG/NIA NIH HHS/United States
- P50 AG016574-04S29004/AG/NIA NIH HHS/United States
- U01 AG006786/AG/NIA NIH HHS/United States
- RR24151 K12/RR/NCRR NIH HHS/United States
- U01 AG006786-22/AG/NIA NIH HHS/United States
- R01 AG015866/AG/NIA NIH HHS/United States
- R01 AG011378/AG/NIA NIH HHS/United States
LinkOut - more resources
Full Text Sources
Other Literature Sources
Medical
