. 2008 Mar;10(3):655-66.
doi: 10.1111/j.1462-5822.2007.01073.x. Epub 2007 Nov 27.

HIV-1 matrix protein p17 binds to monocytes and selectively stimulates MCP-1 secretion: role of transcriptional factor AP-1

Affiliations

HIV-1 matrix protein p17 binds to monocytes and selectively stimulates MCP-1 secretion: role of transcriptional factor AP-1

Elena Marini et al. Cell Microbiol. 2008 Mar.

Abstract

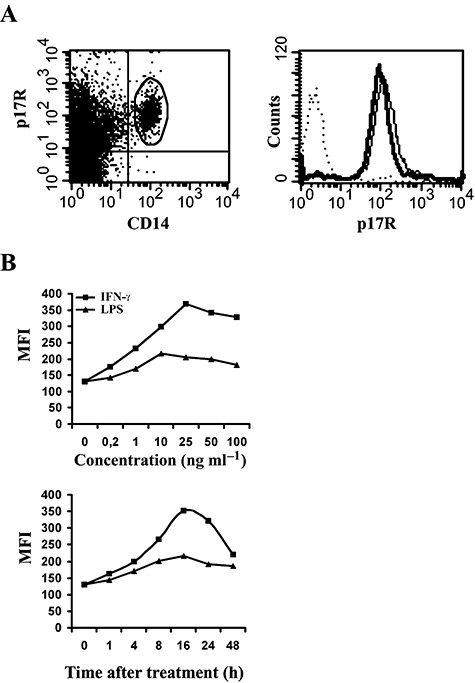
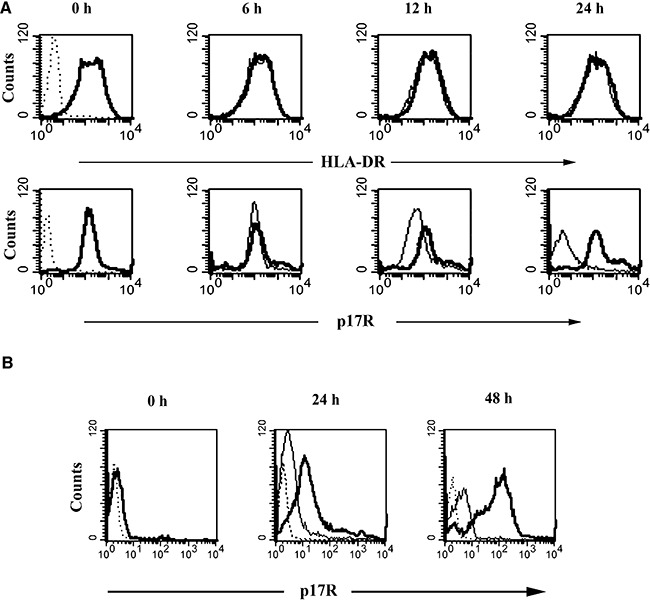
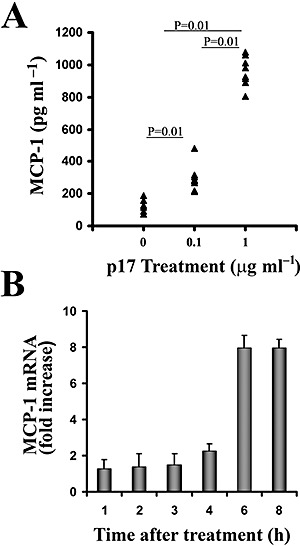
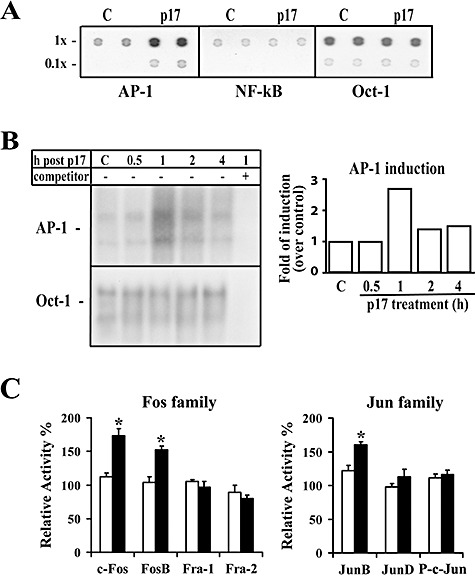
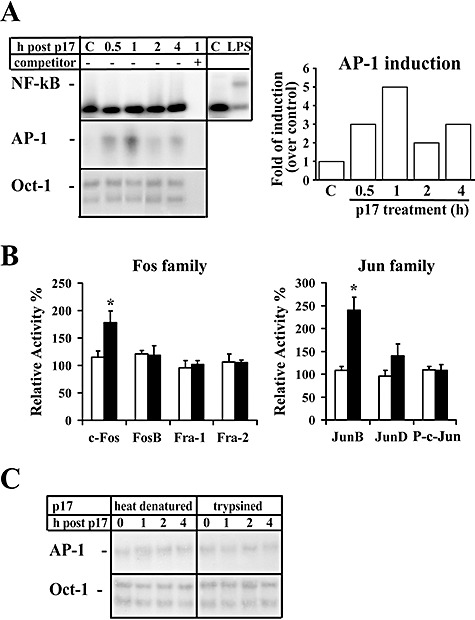
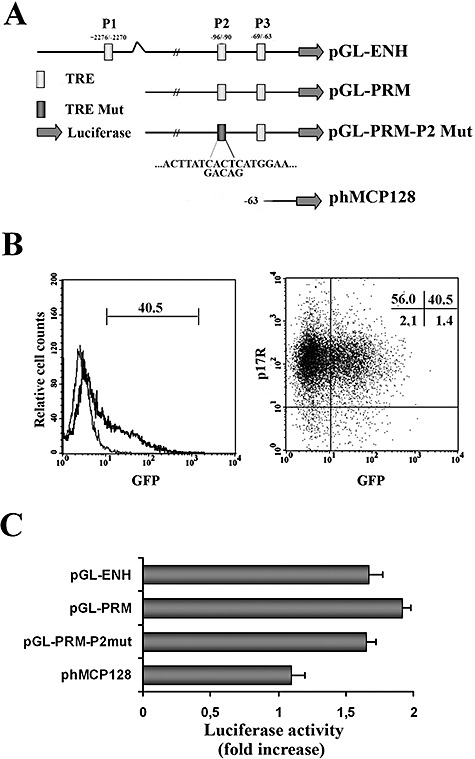
HIV-1 matrix protein p17 activates a variety of cell responses which play a critical role in viral replication and infection. Its activity depends on the expression of p17 receptors (p17R) on the surface of target cells. Whether p17 also plays a role in stimulating human monocytes, a major HIV-1 reservoir, is not known. Here we show that human monocytes constitutively express p17Rs and that p17 selectively triggers these cells to produce MCP-1. The effect of p17 on MCP-1 expression was observed at the transcriptional level and was primarily dependent on the activation of the transcription factor AP-1. p17 increased the binding activity of AP-1 complexes in a time- and dose-dependent manner. Deletion of the AP-1 binding sites in the MCP-1 promoter resulted in the lack of p17-induced MCP-1 transcription. In particular, the P3 binding site located between -69 and -63 position seems to be essential to MCP-1 mRNA induction in p17-treated monocytes. An ever increasing amount of evidences shows a tight link between biologically dysregulated monocytes, AP-1 activation, MCP-1 release and HIV-1 pathogenesis. Overall our results suggest that p17 may play a critical role in the monocyte-mediated inflammatory processes, which are suspected to be major precipitating events in AIDS-defining diseases.


Figures

Figure 1
Figure 1
Expression of p17Rs on human monocytes. Biotin‐conjugated p17 was allowed to react with PBMCs or with purified monocytes. Detection of p17 on the cell surface was performed using APC‐conjugated streptavidin as a specific reagent.
A. Left. Cells were also stained with FITC‐conjugated anti‐CD14 mAb. Data are displayed as bivariate dot plot and show that approximately all monocytes express p17Rs. Right. The expression of p17Rs on purified monocytes is displayed as hystograms. Histograms: bold, p17R+CD14+ cells within freshly purified monocytes; dotted: CD14+ cells within purified monocytes stained with an unrelated biotinilated protein; solid, p17R+ cells within purified monocytes after 72 h of culture in complete medium.
B. Expression of p17Rs on purified activated monocytes. Cells were cultured in the presence of different doses of IFN‐γ or LPS and assayed for p17R expression after 16 h of stimulation (top). The kinetics of p17R upregulation on cells stimulated up to 48 h with optimal doses of IFN‐γ (25 ng ml−1) or LPS (10 ng ml−1) is shown in the bottom panel. These results are representative of three independent experiments.
Figure 2
Figure 2
Turnover of p17Rs on the monocyte surface.
A. Purified monocytes were stained for p17R and HLA‐DR expression, as described in Experimental procedures. At the beginning of culture (0 h) almost 100% of cells were p17R+ and HLA‐DR+ (bold lines). Controls (dotted lines) represent cells stained with isotype IgG (versus HLA‐DR) or with an unrelated biotinylated protein (versus p17R). The cells were then cultured, for 6, 12 and 24 h in the presence (solid lines) or in the absence (bold lines) of cycloheximide.
B. Treatment of monocytes with trypsin for 15 min (0 h) reduced p17R expression (bold line) to almost background levels (dotted line). The cells were then allowed to recover in complete medium in the presence (solid line) or absence (bold line) of cycloheximide. Monocytes were collected 24 h and 48 h after trypsin treatment for p17R staining. These results are representative of three independent experiments.
Figure 3
Figure 3
Induction of MCP‐1 production by p17‐treated monocytes.
A. Purified monocytes obtained from eight healthy donors were treated or not with p17 at a concentration of 0.1 or 1 μg ml−1. Culture supernatants were collected 48 h after the beginning of culture and analysed for the presence of MCP‐1 by a standard quantitative ELISA. Bars represent the mean value of all samples and P‐values were calculated by the Wilcoxon test.
B. Cells treated or not with p17 (1 μg ml−1) were harvested at the specified times, and MCP‐1 and β‐actin levels were analysed by TaqMan rtPCR. MCP‐1 mRNA levels, normalized to β‐actin levels in the same samples, are expressed as fold induction of the levels detected in p17‐untreated cells at the same time points. Bars represent the mean ± SD of triplicate samples.
Figure 4
Figure 4
AP‐1 activation in p17‐treated human monocytes. Nuclear protein extracts obtained from monocytes collected after p17 treatment (1 μg ml−1) were analysed for their binding activity to oligonucleotides specific for different transcription factors.
A. Representative fluorograms of protein/DNA array analysis of AP‐1, NF‐κB and Oct‐1 DNA‐binding activity in nuclear extracts (10 μg per sample) from human monocytes collected 1 h after p17 treatment. Each transcription factor was evaluated in duplicate at 1× concentration (1×) and at 0.1× concentration (0.1×) of the specific oligonucleotides.
B. Representative EMSA autoradiograms using nuclear extracts (10 μg per sample) from human monocytes collected at the specified times after p17 treatment, and AP‐1‐specific radiolabelled oligonucleotides. C: p17‐untreated cells. Protein–DNA complex specificity was confirmed by competition with an excess of unlabelled oligonucleotide probe. DNA‐binding activity to Oct‐1 was used as loading control. The right panel shows a densitometric analysis of changes in the DNA‐binding activity of AP‐1 relative to Oct‐1, expressed as fold of induction over control untreated cells.
C. AP‐1 protein family profiling for DNA‐binding activity of an ELISA‐based transcription factor assay kit using nuclear extracts (4 μg per sample) from human monocytes cultured for 1 h in the presence or absence of p17‐ and AP‐1‐specific oligonucleotides immobilized to a 96‐well plate. Levels of Fos or Jun family members in the active AP‐1 complex of p17‐treated or ‐untreated monocytes are expressed as percentage of relative activity where 100% is referred to 0 h values. Statistical analysis was performed by one‐way anova test. *P < 0.05, statistically different compared with 0 h values. Bars represent the mean ± SD of triplicate samples. Representative data from one of three experiments are shown.
Figure 5
Figure 5
AP‐1 activation in p17‐treated THP‐1 cells. Nuclear protein extracts from THP‐1 cells collected at different times after p17 treatment (1 μg ml−1) were analysed for binding activity to oligonucleotides specific for different transcription factors.
A. Representative autoradiograms of EMSA using nuclear extracts (10 μg per sample) from THP‐1 cells at the specified times after p17 treatment and radiolabelled oligonucleotides specific for NF‐κB, AP‐1 or Oct‐1. C: untreated cells; LPS: LPS‐treated cells (1 μg ml−1 LPS for 0.5 h), used as positive control for NF‐κB activation. Protein–DNA complex specificity was confirmed by competition with an excess of unlabelled oligonucleotide probe. The right panel represents a densitometric analysis of changes in DNA‐binding activity of AP‐1 relative to Oct‐1, used as loading control. Data are expressed as fold of induction over control untreated cells.
B. AP‐1 family profiling for DNA binding activation from an ELISA‐based kit using nuclear extracts (4 μg per sample) from THP‐1 cells cultured for 1 h in the presence or absence of p17‐ and AP‐1‐specific oligonucleotides immobilized to a 96‐well plate. Levels of Fos or Jun family members in the active AP‐1 complex of p17‐treated or ‐untreated monocytes are expressed as percentage of relative activity where 100% is referred to 0 h values. Statistical analysis was performed by one‐way anova test. *P < 0.05, statistically different compared with 0 h values. Bars represent the mean ± SD of three separate experiments in triplicate.
C. Representative EMSA autoradiograms using nuclear extracts from THP‐1 cells collected at the specified times after treatment with boiled or trypsinized p17 and oligonucleotides specific for AP‐1 and for Oct‐1, as loading control.
Figure 6
Figure 6
Analysis of p17‐induced MCP‐1 transcriptional activation.
A. Schematic representation of the four human MCP‐1 reporter constructs used to perform our experiments. pGL‐ENH contains both the proximal promoter (between −107 and +60) and distal enhancer (between −2742 and −2513) regions of MCP‐1. This construct has three AP‐1 binding sites identified by open boxes: P1 is located in the enhancer region while P2 and P3 are placed in the promoter region. pGL‐PRM contains the proximal promoter region only, whereas pGL‐PRM‐P2 Mut contains the proximal promoter region but has a mutated P2 AP‐1 binding site. pHMCP‐128 is a construct with deletion of both P2 and P3 AP‐1 binding sites.
B. The transfection efficiency of purified human monocytes was assessed by flow cytometry using a GFP‐expressing plasmid as a tracer. In the left panel, GFP+ monocytes are displayed in bold in the histogram, as opposed to untransfected cells (thin line). The percentage of GFP+ cells is also reported. Transfection by nucleofection did not impair p17R expression on the surface of monocytes (right). Cells transfected with the pmax‐GFP plasmid were stained with biotin‐conjugated p17 and APC‐conjugated streptavidin to detect p17R expression, and with PI to mark dead cells. Viable monocytes (PI) were gated on FSC/PI dot plot (not shown) and an analysis was performed of GFP versus p17R dot plot. Quadrant statistics are shown.
C. Purified human monocytes were transiently co‐transfected with the pRL‐TK control vector together with one of the plasmids described in (A). Soon after transfection, cells were treated or not with p17 (1 μg ml−1). Renilla and Firefly luciferase activities were determined 6 h after p17 treatment. Relative activity is expressed as fold stimulation as described in Experimental procedures and represent the mean ± SD of quadruplicate samples from three independent experiments.

Similar articles

Cited by

References

    1. Alfano, M. , and Poli, G. (2001) Cytokine and chemokine based control of HIV infection and replication. Curr Pharm Des 7: 993–1013. - PubMed
    1. Behren, A. , Simon, C. , Schwab, B.M. , Loetzsch, E. , Brodbeck, S. , Huber, E. , et al. (2005) Papillomavirus E2 protein induces expression of the matrix metalloproteinase‐9 via the extracellular signal‐regulated kinase/activator protein‐1 pathway. Cancer Res 65: 11613–11621. - PubMed
    1. Biggs, T.E. , Cooke, S.J. , Barton, C.H. , Harris, M.P. , Saksela, K. , and Mann, D.A. (1999) Induction of activator protein 1 (AP‐1) in macrophages by human immunodeficiency virus type‐1 NEF is a cell‐type‐specific response that requires both hck and MAPK signalling events. J Mol Biol 290: 21–35. - PubMed
    1. Cho, N.‐H. , Seong, S.‐Y. , Huh, M.‐S. , Kim, N.‐H. , Choi, M.‐S. , and Kim, I.‐S. (2002) Induction of the gene encoding macrophage chemoattractant protein 1 by Orientia tsutsugamushi in human endothelial cells involves activation of transcription factor activator protein 1. Infect Immun 70: 4841–4850. - PMC - PubMed
    1. Cinque, P. , Vago, L. , Mengozzi, M. , Torri, V. , Ceresa, D. , Licenzi, E. , et al. (1998) Elevated cerebrospinal fluid levels of monocyte chemotactic protein‐1 correlate with HIV‐1 encephalitis and local viral replication. AIDS 12: 1327–1332. - PubMed

Publication types

Substances

LinkOut - more resources