Comparative Study
. 2007 Dec;17(12):1850-64.
doi: 10.1101/gr.6597907. Epub 2007 Nov 7.

Evolution, biogenesis, expression, and target predictions of a substantially expanded set of Drosophila microRNAs

Affiliations
Comparative Study

Evolution, biogenesis, expression, and target predictions of a substantially expanded set of Drosophila microRNAs

J Graham Ruby et al. Genome Res. 2007 Dec.

Abstract

MicroRNA (miRNA) genes give rise to small regulatory RNAs in a wide variety of organisms. We used computational methods to predict miRNAs conserved among Drosophila species and large-scale sequencing of small RNAs from Drosophila melanogaster to experimentally confirm and complement these predictions. In addition to validating 20 of our top 45 predictions for novel miRNA loci, the large-scale sequencing identified many miRNAs that had not been predicted. In total, 59 novel genes were identified, increasing our tally of confirmed fly miRNAs to 148. The large-scale sequencing also refined the identities of previously known miRNAs and provided insights into their biogenesis and expression. Many miRNAs were expressed in particular developmental contexts, with a large cohort of miRNAs expressed primarily in imaginal discs. Conserved miRNAs typically were expressed more broadly and robustly than were nonconserved miRNAs, and those conserved miRNAs with more restricted expression tended to have fewer predicted targets than those expressed more broadly. Predicted targets for the expanded set of microRNAs substantially increased and revised the miRNA-target relationships that appear conserved among the fly species. Insights were also provided into miRNA gene evolution, including evidence for emergent regulatory function deriving from the opposite arm of the miRNA hairpin, exemplified by mir-10, and even the opposite strand of the DNA, exemplified by mir-iab-4.


Figures

Figure 1.
Figure 1.
Performance of miRNA gene prediction. (A) The summed pairwise scores across all 15 two-species comparisons for each miRNA hairpin candidate. Those candidates overlapping the training, test, newly identified, and unvalidated sets of miRNA hairpins are colored as indicated in the key (right) and listed (Supplemental Table S1). (B) The candidate loci, following strand collapse and exon filtering, depicted as in A. The top 100 candidates, which had scores >698, were carried forward as the set of computational gene predictions (Supplemental Table S1). Of the remaining candidates, only a few were likely to be authentic miRNAs. (C) Specificity of the 100 predictions. Plotted are the number of predicted loci that were validated, the number that correctly identified the strand of the miRNA gene, and the number that correctly identified the miRNA 5′ end (Supplemental Table S1), colored as in A. (D) The overlap of the 100 predicted miRNA loci with the training set, test set, and newly identified miRNA loci. Two loci from the training set and two from the test set were not validated by sequencing (red).
Figure 2.
Figure 2.
Correspondence between previously annotated miRNA hairpins and sequenced miRNAs. (A) Overlap between previously annotated miRNA hairpins and the total set of 133 hairpins of canonical miRNAs supported by our high-throughput sequencing (Supplemental Table S2). Mirtronic loci are described elsewhere (Ruby et al. 2007). (B) Small RNAs derived from the mir-7 hairpin. A portion of the mir-7 transcript is shown above its bracket-notation secondary structure, mature miRNA annotation from miRBase v8.1 (Griffiths-Jones 2004) flanked by asterisks, and sequences from the present study. For each sequence, the number of reads giving rise to that sequence and the number of loci to which the sequence maps in the D. melanogaster genome are shown on the right. Highlighted are the most abundant sequences corresponding to the miRNA (red), miRNA* (blue), intervening loop (green), and fragment flanking the 5′ Drosha cleavage site (orange) (Supplemental Text). Analogous data for all previously annotated D. melanogaster miRNAs are provided (Supplemental Table S2). (C) The predicted hairpin structure of the mir-7 hairpin, colored as in B. Lines indicate inferred Drosha and Dicer cleavage sites. (D) Small RNAs derived from the mir-iab-4 and mir-iab4as hairpins, displayed as in B. (E) The predicted secondary structure of the sense mir-iab-4 hairpin precursor, formatted as in C. (F) The predicted secondary structure of the mir-iab-4 reverse complement, mir-iab4as, formatted as in C.
Figure 3.
Figure 3.
Expression and conservation of mir-10. (A) The sequence and bracket-notation secondary structure of the mir-10 hairpin, highlighting the mature miR-10-5p (blue) and the mature miR-10-3p (red), with read abundance along the length of the sequence plotted above and orthologous hairpins aligned below. Nucleotides differing from the D. melanogaster identities are in gray. Vertical lines indicate the edges of the 6-nt seed of each mature RNA. (B) The mir-10 hairpin predicted secondary structure, colored as in A. Horizontal lines indicate the inferred Drosha and Dicer cleavage sites.
Figure 4.
Figure 4.
Newly identified miRNAs. (A) The sequence and bracket-notation secondary structure of the mir-988 hairpin, highlighting the miRNA (red) and the miRNA* (blue), with read abundance along the length of the sequence plotted above and orthologous hairpins aligned below; nonconserved nucleotides in gray (Drosophila Comparative Genome Sequencing and Analysis Consortium 2007a, b). Vertical lines indicate the inferred Drosha and Dicer cleavage sites. Analogous data for all newly identified D. melanogaster miRNAs are provided (Supplemental Table S2). (B) The predicted secondary structure of the mir-988 hairpin, colored as in A. Horizontal lines indicate the inferred Drosha and Dicer cleavage sites. (C) The unusually large hairpin of mir-989, colored as in A. (D) The sequence and bracket-notation secondary structure of the mir-989 hairpin, with coloring and read-abundance display as in A. Conservation across the length of the hairpin is shown below as a histogram, with bar depth indicating for each nucleotide the number of orthologs from the organisms shown in A with that nucleotide conserved.
Figure 5.
Figure 5.
Genomic landscape of miRNA genes. (A) The distribution of miRNA genes and clusters across the D. melanogaster genome, with newly identified miRNAs indicated (red). Euchromatic portions of the genome are drawn to scale, with (+) strand annotations marked above each chromosome and (−) strand annotations marked below. MicroRNA gene clusters, listed together (with gene numbers separated by slashes), were each defined as series of miRNA loci on the same strand of a given chromosome with no intervening gaps >10 kb. (B) Genomic arrangement and conservation of members of the mir-972∼979 cluster. Detection of an ortholog in the specified species is indicated (black box). (C) Genomic arrangement of the mir-310 cluster. Expression profiles among the constituent miRNAs of each labeled subcluster indicate that the two subclusters were expressed independently (Fig. 6E).
Figure 6.
Figure 6.
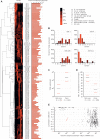
Expression of D. melanogaster miRNAs. (A) The expression profiles of the D. melanogaster miRNAs across the 10 libraries (left) and total level of expression (right). For each library, miRNA reads are normalized to the total reads deriving from miRNA hairpins in that library. Increasing red color intensity indicates an increasing percentage of normalized reads deriving from that library. Read counts and normalized counts for each miRNA in each library are provided (Supplemental Tables S3 and S4). The summed normalized expressions across all 10 libraries are shown on the right; units are the number of miRNA reads per 100,000 total miRNA hairpin reads per library. The tree and image on the left were generated using the publicly available software packages Cluster (Eisen et al. 1998) and MapleTree (L. Simirenko, UC Berkeley). (B) The expression profiles following normalization of four miRNAs whose profiles can be compared to those determined by stage-specific Northern blot (Aravin et al. 2003). (C) The relationship between miRNA conservation and magnitude of total expression. MicroRNAs were separated into two groups based on whether they were conserved (Cons.) or not conserved (Not cons.) beyond the subgenus Sophophora. (Black bars) The median expression for each category; (red bars) the 25th and 75th percentiles. Total expression is defined as in A. (D) The relationship between conservation and breadth of expression, portrayed as in C. The Y-axis indicates the maximum percentage of expression for a given miRNA derived from a single library. (E) The relationship between the genomic distances separating miRNAs and the correlation of their expressions. Each point represents a pair of miRNAs from A, including all pairs from the same strand of the same chromosome, but excluding those that can be attributed to multiple genomic loci. The X-axis indicates the distance between the mature miRNAs in nucleotides. The Y-axis indicates the Pearson correlation coefficient between the normalized expression patterns of the two miRNAs, as displayed in A. The red dots represent miR-991 or miR-992 paired with members of the miR-310∼313 cluster, and miR-283 paired with miR-12/304. Despite their proximity, these subclusters appeared to be expressed independently.
Figure 7.
Figure 7.
MicroRNA target predictions. (A) Confidence of miRNA target prediction versus phylogenic branch length over which sites were conserved in the Drosophila genus. Confidence increased with branch length within 12 Drosophila species (blue line). Confidence versus branch length values for the following fixed sets of species, strictly requiring conservation in every species, are shown as dots of the indicated colors. (Green) Seven species used by Grun et al. (2005) (D. melanogaster, D. erecta, D. yakuba, D. ananassae, D. pseudoobscura, D. mojavensis, D. virilis); (orange) members of the Sophophora subgenus (D. melanogaster, D. sechellia, D. simulans, D. erecta, D. yakuba, D. ananassae, D. persimilis, D. pseudoobscura, D. willistoni); (red) members of the melanogaster subgroup (D. melanogaster, D. sechellia, D. simulans, D. erecta, D. yakuba, D. ananassae); (purple) D. melanogaster and D. pseudoobscura only (Enright et al. 2003; Stark et al. 2003). (B) Sensitivity of target prediction, shown as the average number of sites per conserved miRNA, versus confidence threshold; colored as in A. Note that strict conservation requirements cannot accommodate reduced confidence thresholds, as illustrated by dashed lines. (C) Average number of retained target sites per miRNA for each analysis depicted in A and B at a confidence threshold of 0.5, colored as in A. (D) The number of miRNAs and miRNA families with targets above a confidence threshold of 0.5. Numbers for miRNAs from miRBase v8.1 (Griffiths-Jones 2004) are compared to those for our expanded/corrected set of miRNA annotations. (E) Change to the scope of the predicted miRNA–target network (left) and set of genes predicted to be targeted by miRNAs (right) as a result of miRNA annotation additions and changes. Target-miRNA pairs and target genes identified based on miRBase v8.1 annotations (Griffiths-Jones 2004) are in blue; those based on the expanded/corrected set of miRNA annotations provided by the present study are in red. (F) Specifically expressed miRNAs had fewer predicted targets than did broadly expressed miRNAs. Sets of the most broadly and narrowly expressed miRNAs were collapsed into families based on 6-nt seeds, including only miRNAs conserved beyond the Sophophora subgenus. The number of predicted targets for each family was set to the maximum number of predicted targets of any family member. The median (black bars) and 25th and 75th percentiles (red bars) of the number of targets per miRNA family are indicated for each set.
Figure 8.
Figure 8.
Three models for the genesis of miRNA genes. (Blue bars) Ancestral miRNAs; (orange bars) novel miRNAs. (A) An example of subfunctionalization: a miRNA* acquires function; following gene duplication, one daughter copy maintains the function of the original miRNA, while the other maintains the function of the former miRNA*. Another example of subfunctionalization begins with heterologous 5′ processing. (B) Neofunctionalization: a miRNA gene duplicates; one daughter copy maintains the function of the original miRNA, while the other accumulates mutations that confer novel functionality to either the former miRNA or miRNA*. (C) De novo gene emergence: an unselected portion of a pre-existing transcript, such as an intron or part of a pri-miRNA, acquires the capacity to fold into a hairpin that can be processed into a mature miRNA. That product is selectively maintained because of the fortuitous benefit of gene silencing guided by its seed.

Similar articles

Cited by

References

    1. Abbott A.L., Alvarez-Saavedra E., Miska E.A., Lau N.C., Bartel D.P., Horvitz H.R., Ambros V., Alvarez-Saavedra E., Miska E.A., Lau N.C., Bartel D.P., Horvitz H.R., Ambros V., Miska E.A., Lau N.C., Bartel D.P., Horvitz H.R., Ambros V., Lau N.C., Bartel D.P., Horvitz H.R., Ambros V., Bartel D.P., Horvitz H.R., Ambros V., Horvitz H.R., Ambros V., Ambros V. The let-7 microRNA family members mir-48, mir-84, and mir-241 function together to regulate developmental timing in Caenorhabditis elegans. Dev. Cell. 2005;9:403–414. - PMC - PubMed
    1. Adams M.D., Celniker S.E., Holt R.A., Evans C.A., Gocayne J.D., Amanatides P.G., Scherer S.E., Li P.W., Hoskins R.A., Galle R.F., Celniker S.E., Holt R.A., Evans C.A., Gocayne J.D., Amanatides P.G., Scherer S.E., Li P.W., Hoskins R.A., Galle R.F., Holt R.A., Evans C.A., Gocayne J.D., Amanatides P.G., Scherer S.E., Li P.W., Hoskins R.A., Galle R.F., Evans C.A., Gocayne J.D., Amanatides P.G., Scherer S.E., Li P.W., Hoskins R.A., Galle R.F., Gocayne J.D., Amanatides P.G., Scherer S.E., Li P.W., Hoskins R.A., Galle R.F., Amanatides P.G., Scherer S.E., Li P.W., Hoskins R.A., Galle R.F., Scherer S.E., Li P.W., Hoskins R.A., Galle R.F., Li P.W., Hoskins R.A., Galle R.F., Hoskins R.A., Galle R.F., Galle R.F., et al. The genome sequence of Drosophila melanogaster. Science. 2000;287:2185–2195. - PubMed
    1. Altschul S.F., Gish W., Miller W., Myers E.W., Lipman D.J., Gish W., Miller W., Myers E.W., Lipman D.J., Miller W., Myers E.W., Lipman D.J., Myers E.W., Lipman D.J., Lipman D.J. Basic local alignment search tool. J. Mol. Biol. 1990;215:403–410. - PubMed
    1. Ambros V., Lee R.C., Lavanway A., Williams P.T., Jewell D., Lee R.C., Lavanway A., Williams P.T., Jewell D., Lavanway A., Williams P.T., Jewell D., Williams P.T., Jewell D., Jewell D. MicroRNAs and other tiny endogenous RNAs in C. elegans. Curr. Biol. 2003;13:807–818. - PubMed
    1. Aravin A.A., Lagos-Quintana M., Yalcin A., Zavolan M., Marks D., Snyder B., Gaasterland T., Meyer J., Tuschl T., Lagos-Quintana M., Yalcin A., Zavolan M., Marks D., Snyder B., Gaasterland T., Meyer J., Tuschl T., Yalcin A., Zavolan M., Marks D., Snyder B., Gaasterland T., Meyer J., Tuschl T., Zavolan M., Marks D., Snyder B., Gaasterland T., Meyer J., Tuschl T., Marks D., Snyder B., Gaasterland T., Meyer J., Tuschl T., Snyder B., Gaasterland T., Meyer J., Tuschl T., Gaasterland T., Meyer J., Tuschl T., Meyer J., Tuschl T., Tuschl T. The small RNA profile during Drosophila melanogaster development. Dev. Cell. 2003;5:337–350. - PubMed

Publication types

LinkOut - more resources