Mining alpha-helix-forming molecular recognition features with cross species sequence alignments
- PMID: 17973494
- PMCID: PMC2570644
- DOI: 10.1021/bi7012273
Mining alpha-helix-forming molecular recognition features with cross species sequence alignments
Abstract
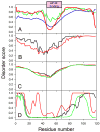
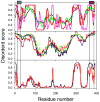
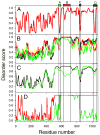
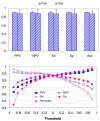
Previously described algorithms for mining alpha-helix-forming molecular recognition elements (MoREs), described by Oldfield et al. (Oldfield, C. J., Cheng, Y., Cortese, M. S., Brown, C. J., Uversky, V. N., and Dunker, A. K. (2005) Comparing and combining predictors of mostly disordered proteins, Biochemistry 44, 1989-2000), also known as molecular recognition features (MoRFs) (Mohan, A., Oldfield, C. J., Radivojac, P., Vacic, V., Cortese, M. S., Dunker, A. K., and Uversky, V. N. (2006) Analysis of Molecular Recognition Features (MoRFs), J. Mol. Biol. 362, 1043-1059), revealed that regions undergoing disorder-to-order transition are involved in many molecular recognition events and are crucial for protein-protein interactions. However, these algorithms were developed using a training data set of a limited size. Here we propose to improve the prediction algorithms by (1) including additional alpha-MoRF examples and their cross species homologues in the positive training set, (2) carefully extracting monomer structure chains from the Protein Data Bank (PDB) as the negative training set, (3) including attributes from recently developed disorder predictors, secondary structure predictions, and amino acid indices, and (4) constructing neural network based predictors and performing validation. Over 50 regions which undergo disorder-to-order transition that were identified in the PDB together with a set of corresponding cross species homologues of each structure-based example were included in a new positive training set. Over 1500 attributes, including disorder predictions, secondary structure predictions, and amino acid indices, were evaluated by the conditional probability method. The top attributes, including VSL2 and VL3 disorder predictions and several physicochemical propensities of amino acid residues, were used to develop the feed forward neural networks. The sensitivity, specificity, and accuracy of the resulting predictor, alpha-MoRF-PredII, were 0.87 +/- 0.10, 0.87 +/- 0.11, and 0.87 +/- 0.08 over 10 cross validations, respectively. We present the results of these analyses and validation examples to discuss the potential improvement of the alpha-MoRF-PredII prediction accuracy.
Figures


Similar articles
-
Analysis of molecular recognition features (MoRFs).J Mol Biol. 2006 Oct 6;362(5):1043-59. doi: 10.1016/j.jmb.2006.07.087. Epub 2006 Aug 4. J Mol Biol. 2006. PMID: 16935303
-
Length-dependent prediction of protein intrinsic disorder.BMC Bioinformatics. 2006 Apr 17;7:208. doi: 10.1186/1471-2105-7-208. BMC Bioinformatics. 2006. PMID: 16618368 Free PMC article.
-
MoRFpred, a computational tool for sequence-based prediction and characterization of short disorder-to-order transitioning binding regions in proteins.Bioinformatics. 2012 Jun 15;28(12):i75-83. doi: 10.1093/bioinformatics/bts209. Bioinformatics. 2012. PMID: 22689782 Free PMC article.
-
[A turning point in the knowledge of the structure-function-activity relations of elastin].J Soc Biol. 2001;195(2):181-93. J Soc Biol. 2001. PMID: 11727705 Review. French.
-
Computational Prediction of MoRFs, Short Disorder-to-order Transitioning Protein Binding Regions.Comput Struct Biotechnol J. 2019 Mar 26;17:454-462. doi: 10.1016/j.csbj.2019.03.013. eCollection 2019. Comput Struct Biotechnol J. 2019. PMID: 31007871 Free PMC article. Review.
Cited by
-
Disordered binding regions and linear motifs--bridging the gap between two models of molecular recognition.PLoS One. 2012;7(10):e46829. doi: 10.1371/journal.pone.0046829. Epub 2012 Oct 3. PLoS One. 2012. PMID: 23056474 Free PMC article.
-
SPA: Short peptide analyzer of intrinsic disorder status of short peptides.Genes Cells. 2010 Jun;15(6):635-46. doi: 10.1111/j.1365-2443.2010.01407.x. Epub 2010 May 20. Genes Cells. 2010. PMID: 20497238 Free PMC article.
-
Protein disorder in the human diseasome: unfoldomics of human genetic diseases.BMC Genomics. 2009 Jul 7;10 Suppl 1(Suppl 1):S12. doi: 10.1186/1471-2164-10-S1-S12. BMC Genomics. 2009. PMID: 19594871 Free PMC article.
-
A comparative analysis of viral matrix proteins using disorder predictors.Virol J. 2008 Oct 23;5:126. doi: 10.1186/1743-422X-5-126. Virol J. 2008. PMID: 18947403 Free PMC article.
-
Intrinsically Disordered Side of the Zika Virus Proteome.Front Cell Infect Microbiol. 2016 Nov 4;6:144. doi: 10.3389/fcimb.2016.00144. eCollection 2016. Front Cell Infect Microbiol. 2016. PMID: 27867910 Free PMC article.
References
-
- Fry DC, Vassilev LT. Targeting protein-protein interactions for cancer therapy. J Mol Med. 2005;83:955–963. - PubMed
-
- Arkin M. Protein-protein interactions and cancer: small molecules going in for the kill. Curr Opin Chem Biol. 2005;9:317–324. - PubMed
-
- Dyson HJ, Wright PE. Coupling of folding and binding for unstructured proteins. Curr Opin Struct Biol. 2002;12:54–60. - PubMed
-
- Uversky VN, Gillespie JR, Fink AL. Why are “natively unfolded” proteins unstructured under physiologic conditions? Proteins. 2000;41:415–427. - PubMed
-
- Dunker AK, Brown CJ, Lawson JD, Iakoucheva LM, Obradovic Z. Intrinsic disorder and protein function. Biochemistry. 2002;41:6573–6582. - PubMed
Publication types
MeSH terms
Substances
Grants and funding
LinkOut - more resources
Full Text Sources

