ISCEV guidelines for clinical multifocal electroretinography (2007 edition)
- PMID: 17972125
- PMCID: PMC2235911
- DOI: 10.1007/s10633-007-9089-2
ISCEV guidelines for clinical multifocal electroretinography (2007 edition)
Abstract
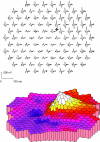
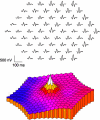
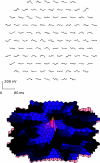
The clinical multifocal electroretinogram (mfERG) is an electrophysiological test of local retinal function. With this technique, many local ERG responses, typically 61 or 103, are recorded from the cone-driven retina under light-adapted conditions. This document specifies guidelines for performance of the test. It also provides detailed guidance on technical and practical issues, as well as on reporting test results. The main objective of the guidelines is to promote consistent quality of mfERG testing and reporting within and among centers. These 2007 guidelines, from the International Society for Clinical Electrophysiology of Vision (ISCEV: http://www.iscev.org ), replace the ISCEV guidelines for the mfERG published in 2003.
Figures


Similar articles
-
ISCEV standard for clinical multifocal electroretinography (mfERG) (2011 edition).Doc Ophthalmol. 2012 Feb;124(1):1-13. doi: 10.1007/s10633-011-9296-8. Epub 2011 Oct 30. Doc Ophthalmol. 2012. PMID: 22038576 Free PMC article. Review.
-
ISCEV standard for clinical pattern electroretinography--2007 update.Doc Ophthalmol. 2007 May;114(3):111-6. doi: 10.1007/s10633-007-9053-1. Epub 2007 Apr 14. Doc Ophthalmol. 2007. PMID: 17435967 Free PMC article.
-
ISCEV standard for clinical multifocal electroretinography (mfERG) (2021 update).Doc Ophthalmol. 2021 Feb;142(1):5-16. doi: 10.1007/s10633-020-09812-w. Epub 2021 Jan 25. Doc Ophthalmol. 2021. PMID: 33492495 Free PMC article.
-
ISCEV extended protocol for the S-cone ERG.Doc Ophthalmol. 2020 Apr;140(2):95-101. doi: 10.1007/s10633-019-09730-6. Epub 2019 Nov 20. Doc Ophthalmol. 2020. PMID: 31749034
-
ISCEV standard for clinical pattern electroretinography (PERG): 2012 update.Doc Ophthalmol. 2013 Feb;126(1):1-7. doi: 10.1007/s10633-012-9353-y. Epub 2012 Oct 17. Doc Ophthalmol. 2013. PMID: 23073702 Review.
Cited by
-
Branch retinal artery occlusion with visual field and multifocal erg in Susac syndrome: a case report.Doc Ophthalmol. 2010 Dec;121(3):223-9. doi: 10.1007/s10633-010-9244-z. Epub 2010 Aug 26. Doc Ophthalmol. 2010. PMID: 20740301
-
Expanding the Mutation Spectrum in ABCA4: Sixty Novel Disease Causing Variants and Their Associated Phenotype in a Large French Stargardt Cohort.Int J Mol Sci. 2018 Jul 27;19(8):2196. doi: 10.3390/ijms19082196. Int J Mol Sci. 2018. PMID: 30060493 Free PMC article.
-
MfERG responses to long-duration white stimuli in glaucoma patients.Doc Ophthalmol. 2011 Apr;122(2):87-97. doi: 10.1007/s10633-011-9263-4. Epub 2011 Feb 22. Doc Ophthalmol. 2011. PMID: 21340609
-
The mfERG response topography with scaled stimuli: effect of the stretch factor.Doc Ophthalmol. 2009 Aug;119(1):51-8. doi: 10.1007/s10633-009-9169-6. Epub 2009 Feb 20. Doc Ophthalmol. 2009. PMID: 19229576
-
Structure versus function: correlation between outer retinal and choroidal thicknesses measured by swept-source OCT with multifocal electroretinography and visual acuity.Int J Retina Vitreous. 2017 Aug 7;3:29. doi: 10.1186/s40942-017-0082-y. eCollection 2017. Int J Retina Vitreous. 2017. PMID: 28794900 Free PMC article.
References
-
- {'text': '', 'ref_index': 1, 'ids': [{'type': 'DOI', 'value': '10.1023/B:DOOP.0000036793.44912.45', 'is_inner': False, 'url': 'https://doi.org/10.1023/b:doop.0000036793.44912.45'}, {'type': 'PubMed', 'value': '15455793', 'is_inner': True, 'url': 'https://pubmed.ncbi.nlm.nih.gov/15455793/'}]}
- Marmor MF, Holder GE, Seeliger MW, Yamamoto S (2004) International Society for Clinical Electrophysiology of Vision. Standard for clinical electroretinography (2004 update). Doc Ophthalmol 108:107–114 - PubMed
-
- {'text': '', 'ref_index': 1, 'ids': [{'type': 'DOI', 'value': '10.1023/A:1022591317907', 'is_inner': False, 'url': 'https://doi.org/10.1023/a:1022591317907'}, {'type': 'PubMed', 'value': '12678274', 'is_inner': True, 'url': 'https://pubmed.ncbi.nlm.nih.gov/12678274/'}]}
- Marmor MF, Hood D, Keating D, Kondo M, Seeliger MW, Miyake Y (2003) Guidelines for basic multifocal electroretinography (mfERG). Doc Ophthalmol 106:105–115 - PubMed
-
- {'text': '', 'ref_index': 1, 'ids': [{'type': 'DOI', 'value': '10.1007/s10633-007-9053-1', 'is_inner': False, 'url': 'https://doi.org/10.1007/s10633-007-9053-1'}, {'type': 'PMC', 'value': 'PMC1896293', 'is_inner': False, 'url': 'https://pmc.ncbi.nlm.nih.gov/articles/PMC1896293/'}, {'type': 'PubMed', 'value': '17435967', 'is_inner': True, 'url': 'https://pubmed.ncbi.nlm.nih.gov/17435967/'}]}
- Holder GE, Brigell M, Hawlina M, Meigen T, Vaegan, Bach M (2007) Standard for pattern electroretinography. Doc Ophthalmol 114:111–116 - PMC - PubMed
-
- {'text': '', 'ref_index': 1, 'ids': [{'type': 'DOI', 'value': '10.1023/A:1026244901657', 'is_inner': False, 'url': 'https://doi.org/10.1023/a:1026244901657'}, {'type': 'PubMed', 'value': '14661909', 'is_inner': True, 'url': 'https://pubmed.ncbi.nlm.nih.gov/14661909/'}]}
- Brigell M, Bach M, Barber C, Moskowitz A, Robson J (2003) Guidelines for calibration of stimulus and recording parameters used in clinical electrophysiology of vision. Doc Ophthalmol 107:185–193 - PubMed
Publication types
MeSH terms
LinkOut - more resources
Full Text Sources

