A universal framework for regulatory element discovery across all genomes and data types
- PMID: 17964271
- PMCID: PMC2900317
- DOI: 10.1016/j.molcel.2007.09.027
A universal framework for regulatory element discovery across all genomes and data types
Abstract
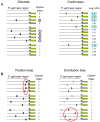
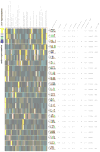
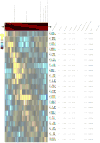
Deciphering the noncoding regulatory genome has proved a formidable challenge. Despite the wealth of available gene expression data, there currently exists no broadly applicable method for characterizing the regulatory elements that shape the rich underlying dynamics. We present a general framework for detecting such regulatory DNA and RNA motifs that relies on directly assessing the mutual information between sequence and gene expression measurements. Our approach makes minimal assumptions about the background sequence model and the mechanisms by which elements affect gene expression. This provides a versatile motif discovery framework, across all data types and genomes, with exceptional sensitivity and near-zero false-positive rates. Applications from yeast to human uncover putative and established transcription-factor binding and miRNA target sites, revealing rich diversity in their spatial configurations, pervasive co-occurrences of DNA and RNA motifs, context-dependent selection for motif avoidance, and the strong impact of posttranscriptional processes on eukaryotic transcriptomes.
Figures


Similar articles
-
MoD Tools: regulatory motif discovery in nucleotide sequences from co-regulated or homologous genes.Nucleic Acids Res. 2006 Jul 1;34(Web Server issue):W566-70. doi: 10.1093/nar/gkl285. Nucleic Acids Res. 2006. PMID: 16845071 Free PMC article.
-
High-resolution DNA-binding specificity analysis of yeast transcription factors.Genome Res. 2009 Apr;19(4):556-66. doi: 10.1101/gr.090233.108. Epub 2009 Jan 21. Genome Res. 2009. PMID: 19158363 Free PMC article.
-
Identification of the cis-acting DNA sequence elements regulating the transcription of the Saccharomyces cerevisiae gene encoding TBP, the TATA box binding protein.J Biol Chem. 1994 Nov 11;269(45):28335-46. J Biol Chem. 1994. PMID: 7961772
-
Identification of cis-regulatory elements in gene co-expression networks using A-GLAM.Methods Mol Biol. 2009;541:1-22. doi: 10.1007/978-1-59745-243-4_1. Methods Mol Biol. 2009. PMID: 19381547 Free PMC article. Review.
-
Transcriptional networks: reverse-engineering gene regulation on a global scale.Curr Opin Microbiol. 2004 Dec;7(6):638-46. doi: 10.1016/j.mib.2004.10.009. Curr Opin Microbiol. 2004. PMID: 15556037 Review.
Cited by
-
Juvenile hormone and its receptor, methoprene-tolerant, control the dynamics of mosquito gene expression.Proc Natl Acad Sci U S A. 2013 Jun 11;110(24):E2173-81. doi: 10.1073/pnas.1305293110. Epub 2013 Apr 30. Proc Natl Acad Sci U S A. 2013. PMID: 23633570 Free PMC article.
-
Evidence for a Contribution of ALA Synthesis to Plastid-To-Nucleus Signaling.Front Plant Sci. 2012 Oct 29;3:236. doi: 10.3389/fpls.2012.00236. eCollection 2012. Front Plant Sci. 2012. PMID: 23112801 Free PMC article.
-
Epigenomic alterations in localized and advanced prostate cancer.Neoplasia. 2013 Apr;15(4):373-83. doi: 10.1593/neo.122146. Neoplasia. 2013. PMID: 23555183 Free PMC article.
-
Attenuated Codon Optimality Contributes to Neural-Specific mRNA Decay in Drosophila.Cell Rep. 2018 Aug 14;24(7):1704-1712. doi: 10.1016/j.celrep.2018.07.039. Cell Rep. 2018. PMID: 30110627 Free PMC article.
-
EZH2-mediated epigenetic silencing in germinal center B cells contributes to proliferation and lymphomagenesis.Blood. 2010 Dec 9;116(24):5247-55. doi: 10.1182/blood-2010-04-280149. Epub 2010 Aug 24. Blood. 2010. PMID: 20736451 Free PMC article.
References
-
- Beer M, Tavazoie S. Predicting gene expression from sequence. Cell. 2004;117:185–198. - PubMed
-
- Bolognese F, Wasner M, Dohna CL, Gurtner A, Ronchi A, Muller H, Manni I, Mossner J, Piaggio G, Mantovani R, Engeland K. The cyclin B2 promoter depends on NF-Y, a trimer whose CCAAT-binding activity is cell-cycle regulated. Oncogene. 1999;18:1845–1853. - PubMed
-
- Bucher P. Weight matrix descriptions of four eukaryotic RNA polymerase II promoter elements derived from 502 unrelated promoter sequences. J Mol Biol. 1990;212:563–578. - PubMed
Publication types
MeSH terms
Substances
Grants and funding
LinkOut - more resources
Full Text Sources
Other Literature Sources
Molecular Biology Databases

