. 2007;35(20):6904-16.
doi: 10.1093/nar/gkm822. Epub 2007 Oct 11.

Dynamics of human replication factors in the elongation phase of DNA replication

Affiliations

Dynamics of human replication factors in the elongation phase of DNA replication

Yuji Masuda et al. Nucleic Acids Res. 2007.

Abstract

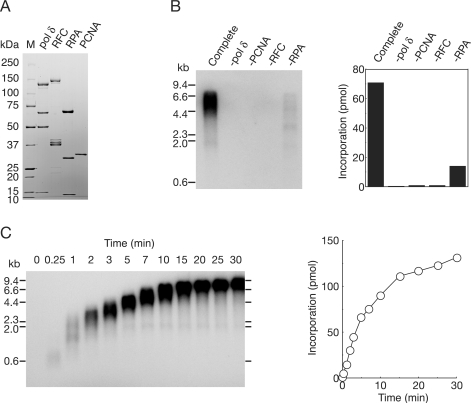
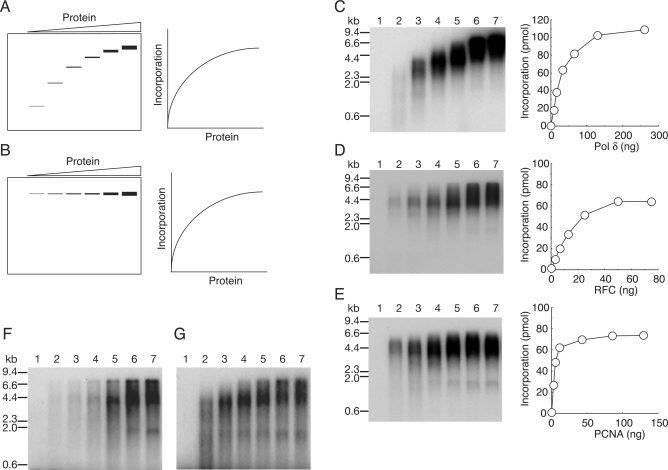
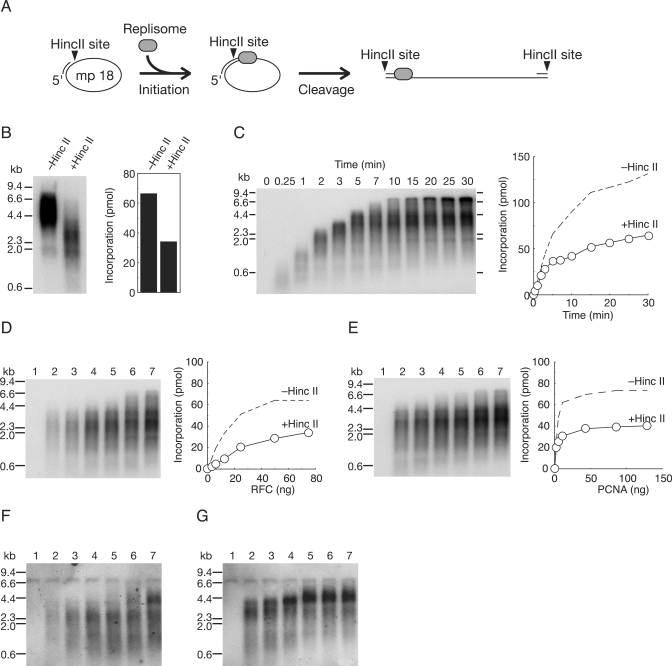
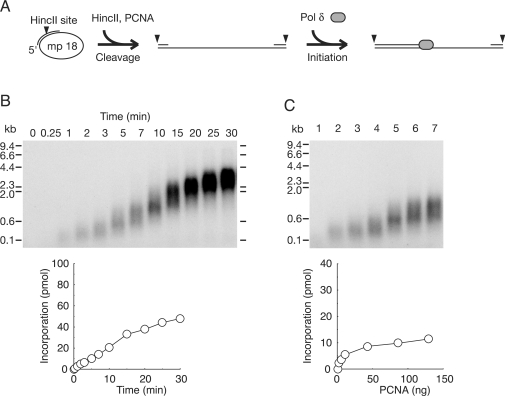
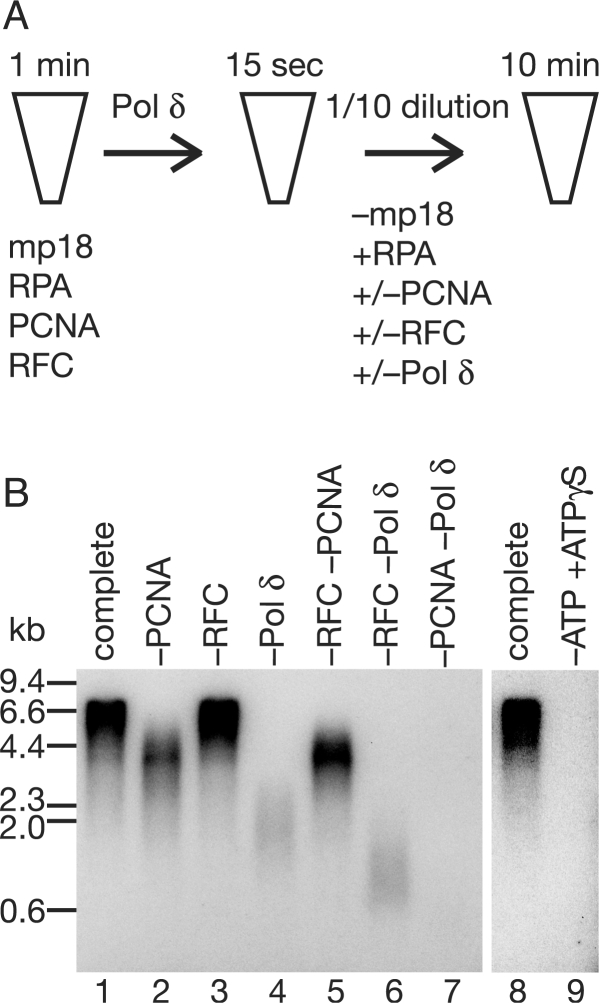
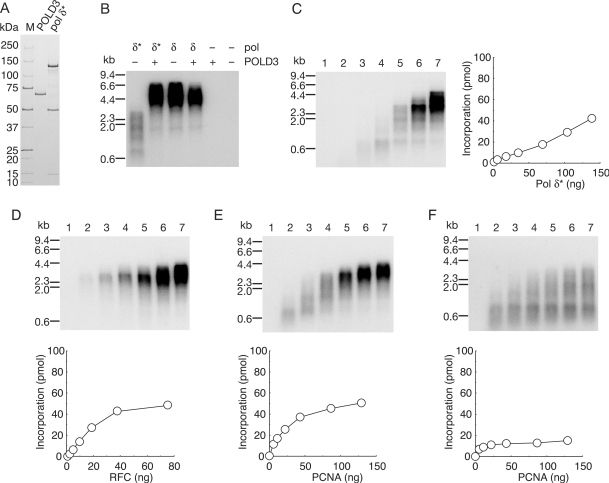
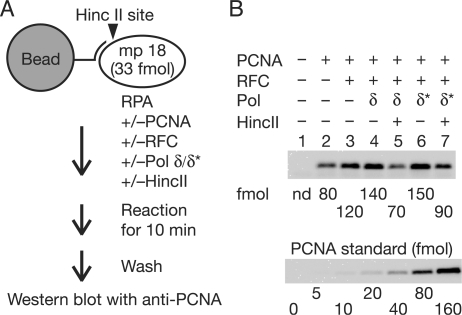
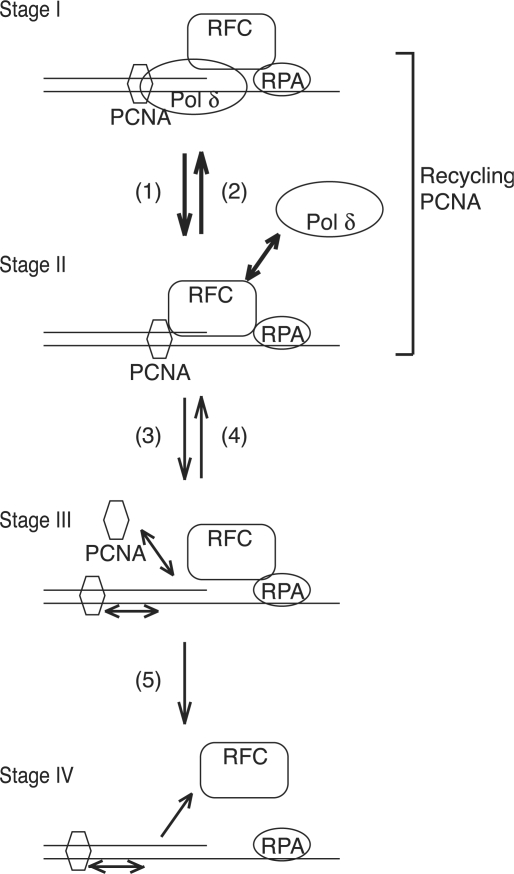
In eukaryotic cells, DNA replication is carried out by coordinated actions of many proteins, including DNA polymerase delta (pol delta), replication factor C (RFC), proliferating cell nuclear antigen (PCNA) and replication protein A. Here we describe dynamic properties of these proteins in the elongation step on a single-stranded M13 template, providing evidence that pol delta has a distributive nature over the 7 kb of the M13 template, repeating a frequent dissociation-association cycle at growing 3'-hydroxyl ends. Some PCNA could remain at the primer terminus during this cycle, while the remainder slides out of the primer terminus or is unloaded once pol delta has dissociated. RFC remains around the primer terminus through the elongation phase, and could probably hold PCNA from which pol delta has detached, or reload PCNA from solution to restart DNA synthesis. Furthermore, we suggest that a subunit of pol delta, POLD3, plays a crucial role in the efficient recycling of PCNA during dissociation-association cycles of pol delta. Based on these observations, we propose a model for dynamic processes in elongation complexes.


Figures

Figure 1.
Figure 1.
Reconstitution of DNA replication with recombinant replication factors on singly primed ss mp18 DNA. (A) SDS–PAGE analysis of purified recombinant proteins. Pol δ (2.4 μg), RFC (1.5 μg), RPA (1.2 μg) and PCNA (0.8 μg) were loaded on a SDS 4–20% gradient polyacrylamide gel and stained with CBB. (B) Requirement of replication factors for synthesis of singly primed ss mp18 DNA. Reactions were carried out for 10 min under the conditions described in the Materials and Methods section or omitting one replication factor. Products were analyzed by 0.7% alkaline-agarose gel electrophoresis as described in the Materials and Methods section. Incorporation of dNMP was measured as described in the Materials and Methods section. (C) Time course of the reaction of DNA synthesis. The reaction products were analyzed by the same procedures as for (B).
Figure 2.
Figure 2.
Analysis of the modes of action of replication factors in ss mp18 DNA replication. (A and B) Expected results of titration of a distributive factor (A) or a processive factor (B) on the DNA replication. The left panels represent gel images of alkaline-agarose gel electrophoresis, and the right panels represent graphs of quantified data for reaction products. See the text for details. (C–E) Titration of replication factors, pol δ (C), RFC (D) and PCNA (E). Reactions were carried out for 10 min under the conditions described in the Materials and Methods section except for variation in the amounts of single protein factors. Reaction products were analyzed by 0.7% alkaline-agarose gel electrophoresis and the newly synthesized DNA were visualized by the incorporated [α-32P]dTMP (left panels). Incorporation of dNMP were measured as described in the Materials and Methods’ section (right panels). Titration of pol δ (C); 0 ng (lane 1), 8.1 ng (lane 2), 16 ng (lane 3), 33 ng (lane 4), 65 ng (lane 5), 130 ng (lane 6) and 260 ng (lane 7). Titration of RFC (D); 0 ng (lane 1), 3.1 ng (lane 2), 6.3 ng (lane 3), 13 ng (lane 4), 25 ng (lane 5), 50 ng (lane 6) and 75 ng (lane 7). Titration of PCNA (E); 0 ng (lane 1), 2.7 ng (lane 2), 5.4 ng (lane 3), 11 ng (lane 4), 43 ng (lane 5), 86 ng (lane 6) and 129 ng (lane 7). (F and G) Titration of RFC (F) and PCNA (G) in the reactions using the 5′-32P-labeled primer. The labeled primer was annealed to ss mp18 DNA, and [α-32P] dTTP was replaced with cold dTTP in the reaction mixtures. Amounts of proteins used in the titration were the same as for D and E.
Figure 3.
Figure 3.
Effects of linearization of newly synthesized DNA just after initiation of DNA replication. (A) Schematic representation of the experimental design. A restriction enzyme, HincII, was introduced into the reaction mixtures. A unique cutting site in the template DNA is located 29-bases downstream from the 3′-hydroxyl end of the primer. After the region was converted to double-stranded DNA by initiation of DNA synthesis, indicating assembly of elongation complexes, the DNA becomes cleavable by HincII. (B) Effects of HincII on synthesis of ss mp18 DNA. (C) Time course of DNA synthesis in the presence of HincII. (D and E) Titration of RFC (D) and PCNA (E) in the presence of HincII. Amounts of PCNA and RFC used in the titration were the same as used for Figure 2 (see legend of Figure 2). Autoradiograms of 0.7% alkaline-agarose gels (left panels) in which the newly synthesized DNA was visualized by the incorporated [α-32P]dTMP, and incorporation of dNMP were measured as described in the Materials and Methods section (right panels). Dotted lines represent results without HincII of Figure 2B. (F and G) Titration of RFC (F) and PCNA (G) in the presence of HincII. [α-32P] dTTP was replaced with cold dTTP in the reaction mixtures and the newly synthesized strands were visualized by Southern blotting with a 5′-labeled oligonucleotide, which is complementary to newly synthesized strand just downstream of HincII site. Amounts of proteins used in the titration were the same as for (D) and (E). Reactions in (B, D–G) were carried out for 10 min under the conditions described in the Materials and Methods section with addition of HincII (10 U/25 μl of reaction mixture).
Figure 4.
Figure 4.
Effect of PCNA loaded spontaneously at ends of template DNA. (A) Schematic representation of the experimental design. A primer that covered HincII site was annealed to ss mp18 DNA. HincII (10 U) was introduced into standard reaction mixtures (25 μl) under the conditions described in the Materials and Methods section except for omitting RFC. After pre-incubation for 1 min, reactions were started by addition of pol δ. (B) Time course of DNA synthesis in the absence of RFC. (C) Titration of PCNA in the reactions without RFC. Amounts of PCNA used in the titration were the same as for Figure 2 (see legend of Figure 2). Reactions were carried out for 10 min. Autoradiograms of 0.7% alkaline-agarose gels in which the newly synthesized DNA were visualized by the incorporated [α-32P]dTMP, and incorporation of dNMP were measured as described in the Materials and Methods section.
Figure 5.
Figure 5.
Effects on size distribution after dilution of elongation complexes. (A) Outline of the assay. At 15 s after the reaction was started by addition of pol δ under standard reaction conditions described in the Materials and methods section, 10-fold dilution was performed with pre-warmed reaction mixtures without template but containing all the protein components or omitting one or two of them. Both reaction mixtures, before and after dilution, contained [α-32P]dTTP. After a further 10 min incubation, the reaction products were analyzed by 0.7% alkaline-agarose gel electrophoresis. (B) An autoradiogram of a 0.7% alkaline-agarose gel. The indicated proteins were omitted in the dilution mixtures. In the reaction shown in lane 9, 1 mM ATP in the dilution mixture was replaced with 2.5 mM ATPγS.
Figure 6.
Figure 6.
Dynamics of replication factors in the elongation phase of DNA synthesis with pol δ*. (A) SDS–PAGE analysis of purified recombinant proteins. Pol δ* (1.9 μg) and POLD3 (0.5 μg) were loaded on a SDS 4–20% gradient polyacrylamide gel and stained with CBB. (B) Reconstitution of pol δ with POLD3 and pol δ*. Reactions were carried out for 10 min under the conditions described in the Materials and Methods section except for pol δ* (70 ng) or pol δ (90 ng) in the absence (−) or presence (+) of POLD3 (20 ng). (C–E) Titration of pol δ* (C), RFC (D) and PCNA (E). Amounts of pol δ* were 0 ng (lane 1), 4.3 ng (lane 2), 17 ng (lane 3), 35 ng (lane 4), 70 ng (lane 5), 100 ng (lane 6), and 140 ng (lane 7). Amounts of RFC used in the titration were 0 ng (lane 1), 2.3 ng (lane 2), 4.7 ng, (lane 3), 9.4 ng (lane 4), 19 ng (lane 5), 38 ng (lane 6) and 75 ng (lane 7). Amounts of PCNA used in titration were 0 ng (lane 1), 5.4 ng (lane 2), 11 ng (lane 3), 22 ng (lane 4), 43 ng (lane 5), 86 ng (lane 6) and 129 ng (lane 7). (F) Titration of PCNA in the presence of HincII. Amount of PCNA is same as (E). Reactions in (C) were carried out for 10 min under the conditions described in the Materials and Methods section. Reactions in (D–F) were carried out for 10 min under the conditions described in the Materials and Methods section except for the amount of pol δ* (140 ng). Products were analyzed by 0.7% alkaline-agarose gel electrophoresis and incorporation of dNMP were measured as described.
Figure 7.
Figure 7.
Amounts of PCNA loaded on DNA during elongation. (A) Outline of the assay. DNA was attached to magnetic beads via biotin–streptavidin linkage. The reactions were carried out for 10 min under the conditions described in the Materials and Methods section except for the amounts of pol δ (33 ng) and pol δ* (140 ng). (B) Western analysis. Chemiluminescence signals were detected with a CCD camera and quantified with reference to a standard curve for PCNA in the same blot.
Figure 8.
Figure 8.
A model for dynamics of replication factors during pol δ dissociation–association cycles. The elongation complex consists of RFC, PCNA and pol δ in the elongation phase of DNA replication (Stage I). Pol δ contacts with PCNA and prevents RFC from dissociating. Contribution of RFC–RPA interaction for stable association in the complex has been proposed (26). Pathway 1, dissociation of pol δ leaving RFC and PCNA on DNA (Stage II). DNA–RFC–PCNA complex formation could be coupled with dissociation of pol δ, mediated by the POLD3 subunit. Pathway 2, reassociation of pol δ to form the elongation complex. The POLD3 subunit of pol δ might mediate efficient transfer of PCNA from RFC to pol δ. Pathway 3, unloading or sliding of PCNA out of the primer terminus, leaving RFC (Stage III). RFC probably interacts with RPA for retaining around primer terminus (26). Pathway 4, reloading of PCNA from solution or PCNA sliding back along the DNA to reform the DNA–RFC–PCNA complex. Pathway 5, dissociation of RFC from DNA (Stage IV). The main pathways are shown as thick arrows.

Similar articles

Cited by

References

    1. Hübscher U, Maga G, Spadari S. Eukaryotic DNA polymerases. Annu. Rev. Biochem. 2002;71:133–163. - PubMed
    1. Johnson A, O’Donnell M. Cellular DNA replicases: components and dynamics at the replication fork. Annu. Rev. Biochem. 2005;74:283–315. - PubMed
    1. Waga S, Stillman B. The DNA replication fork in eukaryotic cells. Annu. Rev. Biochem. 1998;67:721–751. - PubMed
    1. Stillman B. Initiation of eukaryotic DNA replication in vitro. Annu. Rev. Cell. Biol. 1989;5:197–245. - PubMed
    1. MacNeill SA, Baldacci G, Burgers PM, Hübscher U. A unified nomenclature for the subunits of eukaryotic DNA polymerase δ. Trends Biochem. Sci. 2001;26:16–17. - PubMed

Publication types

MeSH terms