

The evolution of bet-hedging adaptations to rare scenarios
- PMID: 17915273
- PMCID: PMC2118055
- DOI: 10.1016/j.tpb.2007.08.006
The evolution of bet-hedging adaptations to rare scenarios
Abstract
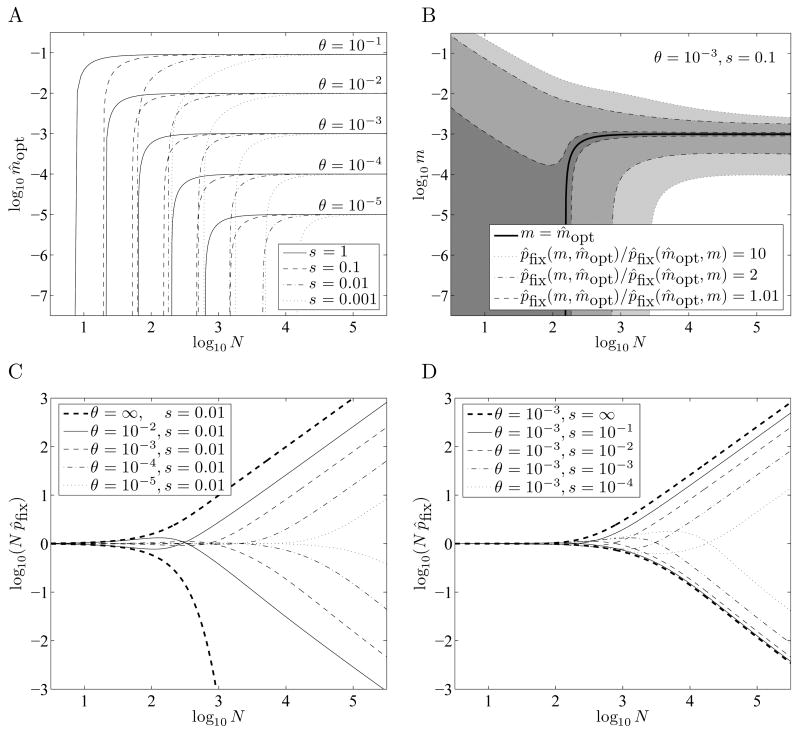
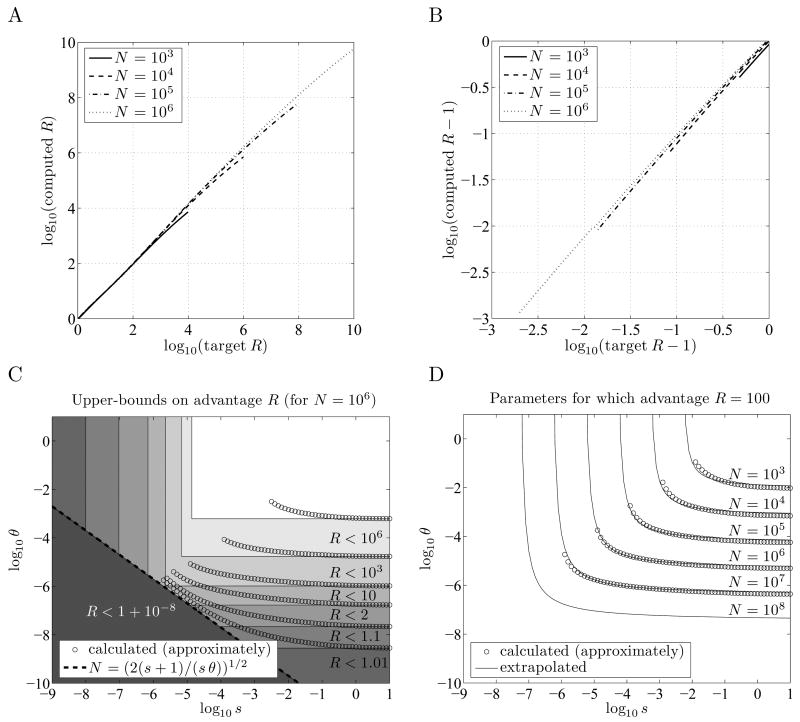
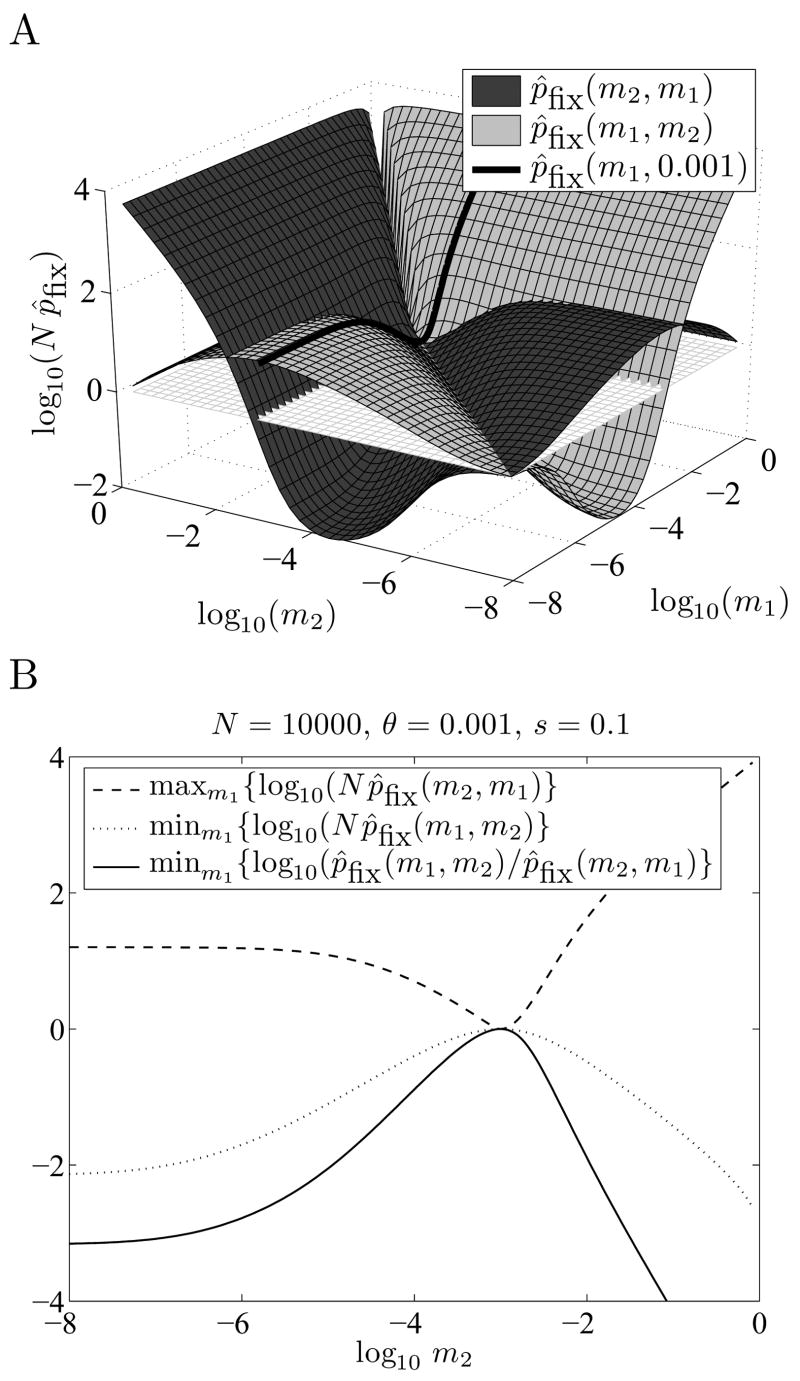
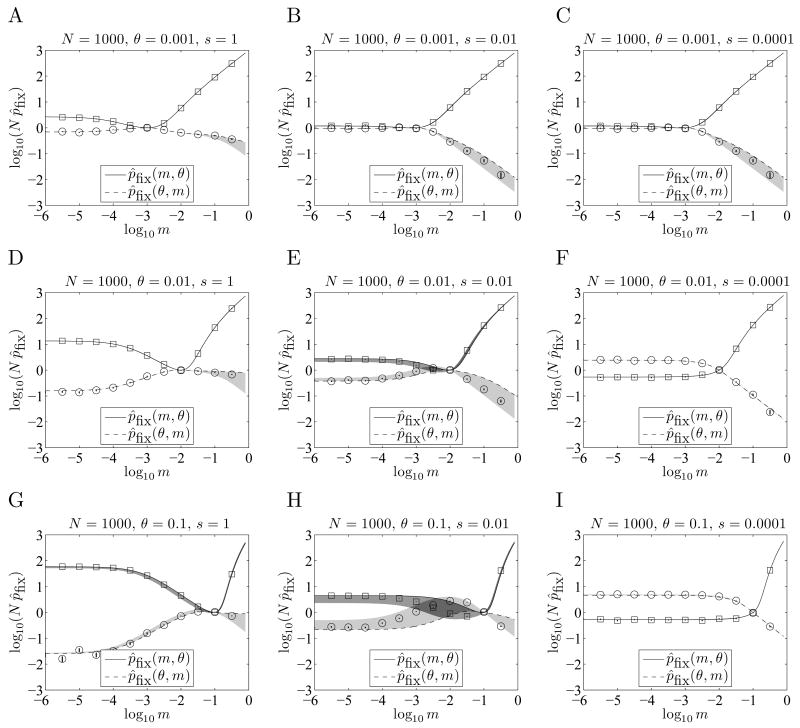
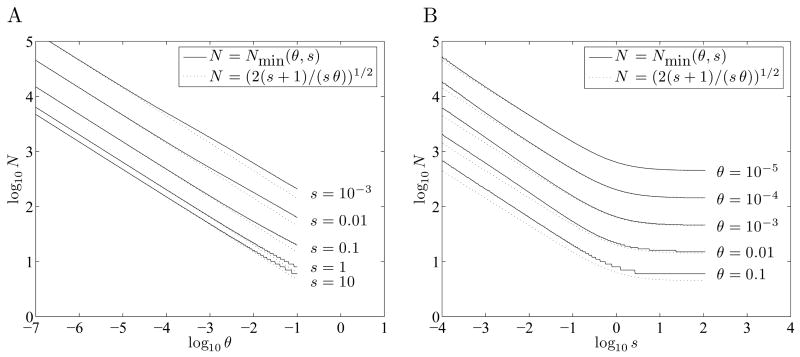
When faced with a variable environment, organisms may switch between different strategies according to some probabilistic rule. In an infinite population, evolution is expected to favor the rule that maximizes geometric mean fitness. If some environments are encountered only rarely, selection may not be strong enough for optimal switching probabilities to evolve. Here we calculate the evolution of switching probabilities in a finite population by analyzing fixation probabilities of alleles specifying switching rules. We calculate the conditions required for the evolution of phenotypic switching as a form of bet-hedging as a function of the population size N, the rate theta at which a rare environment is encountered, and the selective advantage s associated with switching in the rare environment. We consider a simplified model in which environmental switching and phenotypic switching are one-way processes, and mutation is symmetric and rare with respect to the timescale of fixation events. In this case, the approximate requirements for bet-hedging to be favored by a ratio of at least R are that sN>log(R) and thetaN>square root R .
Figures
Similar articles
-
Short-term insurance versus long-term bet-hedging strategies as adaptations to variable environments.Evolution. 2019 Feb;73(2):145-157. doi: 10.1111/evo.13659. Epub 2018 Dec 26. Evolution. 2019. PMID: 30549260 Free PMC article.
-
Shortsighted Evolution Constrains the Efficacy of Long-Term Bet Hedging.Am Nat. 2019 Mar;193(3):409-423. doi: 10.1086/701786. Epub 2019 Jan 24. Am Nat. 2019. PMID: 30794447
-
Experimental evolution of bet hedging.Nature. 2009 Nov 5;462(7269):90-3. doi: 10.1038/nature08504. Nature. 2009. PMID: 19890329
-
Modes of response to environmental change and the elusive empirical evidence for bet hedging.Proc Biol Sci. 2011 Jun 7;278(1712):1601-9. doi: 10.1098/rspb.2011.0176. Epub 2011 Mar 16. Proc Biol Sci. 2011. PMID: 21411456 Free PMC article. Review.
-
Bet-hedging in parasitoids: when optimization is not the best strategy to cope with climatic extremes.Curr Res Insect Sci. 2024 Feb 20;5:100076. doi: 10.1016/j.cris.2024.100076. eCollection 2024. Curr Res Insect Sci. 2024. PMID: 39027356 Free PMC article. Review.
Cited by
-
Differential Expression of Two Copies of the irmA Gene in the Enteroaggregative E. coli Strain 042.Microbiol Spectr. 2022 Aug 31;10(4):e0045422. doi: 10.1128/spectrum.00454-22. Epub 2022 Jun 29. Microbiol Spectr. 2022. PMID: 35766495 Free PMC article.
-
Defining fitness in evolutionary models.J Genet. 2008 Dec;87(4):339-48. doi: 10.1007/s12041-008-0056-9. J Genet. 2008. PMID: 19147923 Review.
-
Adaptation to fluctuations in temperature by nine species of bacteria.Ecol Evol. 2018 Feb 14;8(5):2901-2910. doi: 10.1002/ece3.3823. eCollection 2018 Mar. Ecol Evol. 2018. PMID: 29531704 Free PMC article.
-
Natural selection for imprecise vertical transmission in host-microbiota systems.Nat Ecol Evol. 2022 Jan;6(1):77-87. doi: 10.1038/s41559-021-01593-y. Epub 2021 Dec 23. Nat Ecol Evol. 2022. PMID: 34949814 Free PMC article.
-
Pernicious pathogens or expedient elements of inheritance: the significance of yeast prions.PLoS Pathog. 2014 Apr 10;10(4):e1003992. doi: 10.1371/journal.ppat.1003992. eCollection 2014 Apr. PLoS Pathog. 2014. PMID: 24722628 Free PMC article. Review. No abstract available.
References
-
- Andreadis TG. Observations on installment egg hatching in the brown salt marsh mosquito, Aedes cantator. J Am Mosq Control Assoc. 1990;6:727–729. - PubMed
-
- Avery SV. Microbial cell individuality and the underlying sources of heterogeneity. Nat Rev Micro. 2006;4:577. - PubMed
-
- Balaban NQ, Merrin J, Chait R, Kowalik L, Leibler S. Bacterial persistence as a phenotypic switch. Science. 2004;305:1622–1625. - PubMed
-
- Bell JR, Bohan DA, Shaw EM, Weyman GS. Ballooning dispersal using silk: world fauna, phylogenies, genetics and models. Bull Entomol Res. 2005;95:69–114. - PubMed
Publication types
MeSH terms
Grants and funding
LinkOut - more resources
Full Text Sources
