. 2007 Nov;81(21):12049-60.
doi: 10.1128/JVI.00969-07. Epub 2007 Aug 29.

Nuclear magnetic resonance structure of the N-terminal domain of nonstructural protein 3 from the severe acute respiratory syndrome coronavirus

Affiliations

Nuclear magnetic resonance structure of the N-terminal domain of nonstructural protein 3 from the severe acute respiratory syndrome coronavirus

Pedro Serrano et al. J Virol. 2007 Nov.

Abstract

This paper describes the structure determination of nsp3a, the N-terminal domain of the severe acute respiratory syndrome coronavirus (SARS-CoV) nonstructural protein 3. nsp3a exhibits a ubiquitin-like globular fold of residues 1 to 112 and a flexibly extended glutamic acid-rich domain of residues 113 to 183. In addition to the four beta-strands and two alpha-helices that are common to ubiquitin-like folds, the globular domain of nsp3a contains two short helices representing a feature that has not previously been observed in these proteins. Nuclear magnetic resonance chemical shift perturbations showed that these unique structural elements are involved in interactions with single-stranded RNA. Structural similarities with proteins involved in various cell-signaling pathways indicate possible roles of nsp3a in viral infection and persistence.


Figures
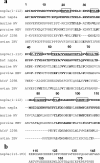
FIG. 1.
FIG. 1.
(a) Sequence alignment of human SARS-CoV nsp3a(1-112) and the homologous regions from bat SARS-CoV (accession no. AAZ67050), murine hepatitis virus (HV) (strain A59; accession no. NP_740609), porcine hemagglutinating encephalomyelitis virus (HEV) (strain VW572; accession no. YP_459949), human CoV (hCoV 229E; accession no. NP_835345), and avian infectious bronchitis virus (IBV) (strain Cal99; accession no. AAS00078). The residue numbers at the top correspond to the sequence of the human SARS-CoV and do not account for the insertions shown in the drawing. In each sequence the conserved residues relative to SARS-CoV nsp3a are in bold. The regular secondary structure elements of SARS-CoV nsp3a are indicated by boxes. (b) Sequence of the subdomain of residues 113 to 183 of human SARS-CoV.
FIG. 2.
FIG. 2.
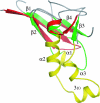
NMR structure of nsp3a(1-112). (a) Stereo view of the polypeptide backbone of a bundle of 20 energy-minimized CYANA conformers superimposed for minimal RMSD value of the backbone atoms of residues 20 to 108. The N-terminal segment of residues 1 to 19 is flexibly disordered (Fig. 5). (b) Stereo view of a ribbon representation of the conformer with the smallest RMSD relative to the mean coordinates of the ensemble of panel a. In both panels, β-strands are cyan and helices are red. Selected residue positions are indicated in panel a, and the regular secondary structures are identified in panel b.
FIG. 3.
FIG. 3.
Electrostatic surface potential of nsp3a(1-112). Positive and negative electrostatic potential is represented in blue and red, respectively. On the left we show the surface of helices α2, α3, and 310 and of the loop between strands β3 and β4, which contain a high density of acidic residues (Fig. 1). On the right are shown the surface of helix α1 and strands β1, β2, and β4, which contain mainly neutral and basic residues. Positions of selected charged residues are indicated.
FIG. 4.
FIG. 4.
Superposition of nsp3a(1-112) (green, regular secondary structures that superimpose with nsp3d; yellow, segments not present in nsp3d; gray, other segments) and the ubiquitin-like domain of nsp3d (31) (PDB code 2FE8) (red, regular secondary structures that superimpose with nsp3a; gray, other segments). The structure superposition was performed using the SSM module of Coot (7). Thirty Cα atoms were superimposed with a RMSD value of 2.22 Å, i.e., from nsp3a(1-112) residues 20 to 26, 40 to 46, 49 to 54, 87 to 91, and 100 to 104 and from nsp3d residues 725 to 731, 739 to 745, 748 to 753, 754 to 758, and 773 to 777.
FIG. 5.
FIG. 5.
15N{1H}-NOE values plotted as relative intensities (Irel), versus the sequence of nsp3a(1-112). Diamonds represent experimental measurements, which are linked by straight lines along the sequence. Gaps represent proline residues, which lack a backbone 1H atom, or overlapping residues in the 15N-1H correlation spectrum that could not be integrated accurately. The experiment was recorded at a 1H frequency of 600 MHz, using a saturation period of 3.0 s and a total interscan delay of 5.0 s.
FIG. 6.
FIG. 6.
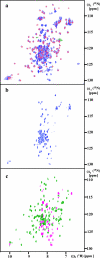
(a) Superposition of the 2-D [15N,1H]-HSQC spectra of nsp3a(1-183) (blue) and nsp3a(1-112) (red). (b) High-contour-level presentation of a 2-D [15N,1H]-HSQC spectrum of nsp3a(1-183). (c) Heteronuclear NOE experiment with nsp3a(1-183), using a saturation period of 3.0 s and an interscan delay of 5.0 s. Negative and positive peaks are shown in pink and green, respectively.
FIG. 7.
FIG. 7.
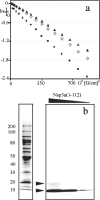
Study of the oligomeric state of nsp3a(1-112). (a) Data obtained from NMR diffusion experiments at 700 MHz. The relative NMR signal intensity (ln I/Io) is plotted versus the square of the gradient field strength, G2. ⋄, nsp3a(1-112); ▪, ribonuclease A; ▴, chymotrypsinogen. (b) PFO-PAGE of nsp3a(1-112); the sizes of the protein complexes were estimated from the benchmark protein ladder shown on the left (Invitrogen). The protein concentration increases from right to left in three steps of 250 μM, 500 μM, and 1 mM. The filled arrowheads indicate the positions of the monomeric (12.6 kDa) and dimeric (25.2 kDa) forms of nsp3a(1-112).
FIG. 8.
FIG. 8.
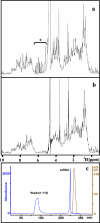
(a) 1-D 1H NMR spectrum of nsp3a(1-112) before removal of copurifying nucleic acids. Spectra were measured at 25 °C with water presaturation on a Bruker DRX700 spectrometer. Sixty-four scans were accumulated. The presence of characteristic nucleic acid signals in the area from 4.8 to 6.4 ppm (*) is readily apparent (1′H, 2′H, 3′H, 4′H, 5′H, 5″H of all nucleotides and pyrimidine 5H are typically observed in this spectral region). (b) 1-D 1H NMR spectrum of the nucleic acid-free nsp3a(1-112) sample used for the NMR structure determination (see Materials and Methods). The weak peaks between 4.8 and 6.4 ppm are part of the protein spectrum. (c) Isolation of RNA that copurified with nsp3a(1-112). The chromatogram was obtained after loading a sample of unfolded nsp3a(1-112) in 6 M guanidinium-HCl onto a size exclusion column. Absorbance at 280 nm and conductivity are shown in blue and brown, respectively. The protein and ssRNA absorption peaks are labeled; the high conductivity observed after 320 minutes is due to guanidinium-HCl.
FIG. 9.
FIG. 9.
Mass spectrum of the isolated ssRNA fragment. The proposed structures for the main peaks are presented together with their corresponding molecular weights and atomic composition.
FIG. 10.
FIG. 10.
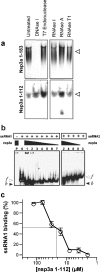
Association of nsp3a(1-183) and nsp3a(1-112) purified from E. coli with nucleic acids. (a) Nucleic acid was visualized with SYBR-gold staining before or after digestion with nucleases specific to DNA (DNase I or T7 endonuclease) or RNA (RNase I, RNase A, or RNase T1). Cleavage assays were performed at 37°C for 1 h, and digested samples were analyzed by native electrophoresis on precast 6% polyacrylamide gels. Open arrowheads denote copurified nucleic acid species associated with nsp3a(1-112) or nsp3a(1-183), respectively. (b) EMSAs were performed to estimate the RNA binding affinity of nsp3a(1-112). Samples containing ssRNA1 or ssRNA2 were incubated at 37°C for 1 h with variable concentrations of protein and analyzed by native electrophoresis on precast 6% polyacrylamide gels. RNA was detected by SYPRO-gold poststain, and the fraction of bound RNA was calculated relative to the maximum binding observed in each experiment. Lane P, protein only; lanes 0, ssRNA only; lanes 1 to 7 (left panel), ssRNA with twofold dilutions of protein from a final concentration of 128 μM to 2 μM for ssRNA1; lanes 2, 4, 6, and 8 (right panel), ssRNA with fourfold dilutions of protein from 64 μM to 1 μM for ssRNA2. Electrophoretic mobilities of free (f) and bound (b) forms of each ssRNA species are indicated with arrowheads. (c) ssRNA1-binding at variable concentrations of nsp3a(1-112), as calculated from the EMSA data shown in panel b.
FIG. 11.
FIG. 11.
EMSAs were performed to evaluate the affinity of nsp3a(1-112) for different nucleic acid species. (a) Gels obtained after loading mixtures of nsp3a(1-112) with 10 different ssDNA fragments (1 to 10). Lanes labeled P and M correspond to nucleic acid-free protein and nucleic acid marker, respectively. Comparison of the two gels, using nucleic acid-specific (left) and protein-specific (right) stains, indicates that nsp3a(1-112) does not exhibit affinity for ssDNAs. (b) Gels containing decreasing concentrations (100 to 1.6 μM) of nsp3a(1-112), in the presence of 800 ng of an ssRNA 40-mer lacking the sequence AUA (left), a double-stranded RNA 20-mer (center), and an ssDNA 40-mer (right). In lanes labeled N, only nucleic acid species were loaded. No interaction of nsp3a(1-112) and nucleic acids (NA) was observed under any of the above conditions. All experiments were performed after incubation of nsp3a(1-112) and the corresponding nucleic acid fragment for 1 h at 37 °C.
FIG. 12.
FIG. 12.
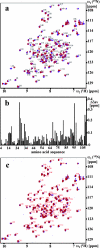
(a) Superposition of the [15N,1H]-HSQC spectra of nsp3a(1-112) in the absence (blue) and presence (red) of a fourfold excess of the exogenous ssRNA2 (see text). (b) Plot versus the amino acid sequence of the chemical shift changes in the backbone 1HN-15N moieties of nsp3a(1-112) due to ssRNA2 binding. Δδav is a weighted average of the 1H and 15N chemical shift differences determined from comparison of the [15N,1H]-HSQC spectra shown in panel a: Δδav = {0.5[Δδ(1HN)2 + (0.2Δδ(15N))2]}1/2. (c) Superposition of the [15N,1H]-HSQC spectra of nsp3a(1-112) in the absence (blue) and presence (red) of a fourfold excess of Octa-U.
FIG. 13.
FIG. 13.
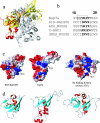
Comparison of nsp3a with Ras-interacting proteins. (a) In a complex consisting of a Ras dimer (gray) bound to two RID-RalGDS subunits (yellow) (PDB code ILFD), nsp3a(1-112) (red) is superimposed on one of the two RID subunits. The residues used for the superposition were identified using the software DALI with the NMR structure of nsp3a(1-112) and the X-ray structure of the Ras-RID-RalGDS complex (12): for nsp3a(1-112), residues 17 to 29, 33 to 37, 41 to 63, 83 to 87, 88 to 94, 95 to 98, and 101 to 108; for RID-RalGDS, residues 14 to 26, 27 to 31, 32 to 54, 55 to 59, 63 to 69, 74 to 77, and 93 to 100. The Cα atoms of these residues could be superimposed with an RMSD of 2.3 Å. (b) Sequence alignment of a dodecapeptide containing strand β1 of nsp3a (box) with the corresponding segments in some members of the Ras-interacting protein family, with the residue numbers of nsp3a indicated. (c) Electrostatic potential surfaces of nsp3a(1-112), RID-RalGDS, and Ra-AF6. The positions of the conserved residues corresponding to R23 in nsp3a(1-112) are indicated. (d) Ribbon presentations of the same structures as in panel c.

Similar articles

Cited by

References

    1. Altieri, A. S., D. P. Hinton, and R. A. Byrd. 1995. Association of biomolecular systems via pulsed field gradient NMR self-diffusion measurements. J. Am. Chem. Soc. 117:7566-7567.
    1. Barretto, N., D. Jukneline, K. Ratia, Z. Chen, A. D. Mesecar, and S. C. Baker. 2006. Deubiquitinating activity of the SARS-CoV papain-like protease. Adv. Exp. Med. Biol. 581:37-41. - PMC - PubMed
    1. Barretto, N., D. Jukneline, K. Ratia, Z. Chen, A. D. Mesecar, and S. C. Baker. 2005. The papain-like protease of severe acute respiratory syndrome coronavirus has deubiquitinating activity. J. Virol. 79:15189-15198. - PMC - PubMed
    1. Chen, C. J., and S. Makino. 2004. Murine coronavirus replication induces cell cycle arrest in G0/G1 phase. J. Virol. 78:5658-5669. - PMC - PubMed
    1. Cornell, W. D., P. Cieplak, C. I. Bayly, I. R. Gould, J. Merz, K. M., D. M. Ferguson, D. C. Spellmyer, T. Fox, J. W. Caldwell, and P. A. Kollman. 1995. A second generation force field for the simulation of proteins, nucleic acids, and organic molecules. J. Am. Chem. Soc. 117:5179-5197.

Publication types

MeSH terms

LinkOut - more resources