Regulation of the mitochondrial dynamin-like protein Opa1 by proteolytic cleavage
- PMID: 17709430
- PMCID: PMC2064541
- DOI: 10.1083/jcb.200704112
Regulation of the mitochondrial dynamin-like protein Opa1 by proteolytic cleavage
Abstract
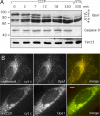
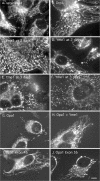
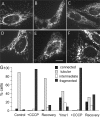
The dynamin-related protein Opa1 is localized to the mitochondrial intermembrane space, where it facilitates fusion between mitochondria. Apoptosis causes Opa1 release into the cytosol and causes mitochondria to fragment. Loss of mitochondrial membrane potential also causes mitochondrial fragmentation but not Opa1 release into the cytosol. Both conditions induce the proteolytic cleavage of Opa1, suggesting that mitochondrial fragmentation is triggered by Opa1 inactivation. The opposite effect was observed with knockdown of the mitochondrial intermembrane space protease Yme1. Knockdown of Yme1 prevents the constitutive cleavage of a subset of Opa1 splice variants but does not affect carbonyl cyanide m-chlorophenyl hydrazone or apoptosis-induced cleavage. Knockdown of Yme1 also increases mitochondrial connectivity, but this effect is independent of Opa1 because it also occurs in Opa1 knockdown cells. We conclude that Yme1 constitutively regulates a subset of Opa1 isoforms and an unknown mitochondrial morphology protein, whereas the loss of membrane potential induces the further proteolysis of Opa1.
Figures


Similar articles
-
Metalloprotease-mediated OPA1 processing is modulated by the mitochondrial membrane potential.Biol Cell. 2008 May;100(5):315-25. doi: 10.1042/BC20070110. Biol Cell. 2008. PMID: 18076378
-
Regulation of mitochondrial morphology through proteolytic cleavage of OPA1.EMBO J. 2006 Jul 12;25(13):2966-77. doi: 10.1038/sj.emboj.7601184. Epub 2006 Jun 15. EMBO J. 2006. PMID: 16778770 Free PMC article.
-
Inducible proteolytic inactivation of OPA1 mediated by the OMA1 protease in mammalian cells.J Cell Biol. 2009 Dec 28;187(7):959-66. doi: 10.1083/jcb.200906083. J Cell Biol. 2009. PMID: 20038677 Free PMC article.
-
A cut short to death: Parl and Opa1 in the regulation of mitochondrial morphology and apoptosis.Cell Death Differ. 2007 Jul;14(7):1275-84. doi: 10.1038/sj.cdd.4402145. Epub 2007 Apr 20. Cell Death Differ. 2007. PMID: 17464328 Review.
-
OPA1 and PARL keep a lid on apoptosis.Cell. 2006 Jul 14;126(1):27-9. doi: 10.1016/j.cell.2006.06.030. Cell. 2006. PMID: 16839872 Review.
Cited by
-
Molecular mechanisms of mitochondrial dynamics.Nat Rev Mol Cell Biol. 2024 Oct 17. doi: 10.1038/s41580-024-00785-1. Online ahead of print. Nat Rev Mol Cell Biol. 2024. PMID: 39420231 Review.
-
The Novel Anticancer Aryl-Ureido Fatty Acid CTU Increases Reactive Oxygen Species Production That Impairs Mitochondrial Fusion Mechanisms and Promotes MDA-MB-231 Cell Death.Int J Mol Sci. 2024 Oct 1;25(19):10577. doi: 10.3390/ijms251910577. Int J Mol Sci. 2024. PMID: 39408906 Free PMC article.
-
Opa1 processing is dispensable in mouse development but is protective in mitochondrial cardiomyopathy.Sci Adv. 2024 Aug 2;10(31):eadp0443. doi: 10.1126/sciadv.adp0443. Epub 2024 Aug 2. Sci Adv. 2024. PMID: 39093974 Free PMC article.
-
Differentiation activates mitochondrial OPA1 processing in myoblast cell lines.Mitochondrion. 2024 Sep;78:101933. doi: 10.1016/j.mito.2024.101933. Epub 2024 Jul 8. Mitochondrion. 2024. PMID: 38986925 Free PMC article.
-
OMA1-Mediated Mitochondrial Dynamics Balance Organellar Homeostasis Upstream of Cellular Stress Responses.Int J Mol Sci. 2024 Apr 22;25(8):4566. doi: 10.3390/ijms25084566. Int J Mol Sci. 2024. PMID: 38674151 Free PMC article. Review.
References
-
- Arnoult, D., A. Grodet, Y.J. Lee, J. Estaquier, and C. Blackstone. 2005. Release of OPA1 during apoptosis participates in the rapid and complete release of cytochrome c and subsequent mitochondrial fragmentation. J. Biol. Chem. 280:35742–35750. - PubMed
-
- Cipolat, S., T. Rudka, D. Hartmann, V. Costa, L. Serneels, K. Craessaerts, K. Metzger, C. Frezza, W. Annaert, L. D'Adamio, et al. 2006. Mitochondrial rhomboid PARL regulates cytochrome c release during apoptosis via OPA1-dependent cristae remodeling. Cell. 126:163–175. - PubMed
-
- Duvezin-Caubet, S., R. Jagasia, J. Wagener, S. Hofmann, A. Trifunovic, A. Hansson, A. Chomyn, M.F. Bauer, G. Attardi, N.G. Larsson, et al. 2006. Proteolytic processing of OPA1 links mitochondrial dysfunction to alterations in mitochondrial morphology. J. Biol. Chem. 281:37972–37979. - PubMed
-
- Frezza, C., S. Cipolat, O. Martins de Brito, M. Micaroni, G.V. Beznoussenko, T. Rudka, D. Bartoli, R.S. Polishuck, N.N. Danial, B. De Strooper, and L. Scorrano. 2006. OPA1 controls apoptotic cristae remodeling independently from mitochondrial fusion. Cell. 126:177–189. - PubMed
Publication types
MeSH terms
Substances
Grants and funding
LinkOut - more resources
Full Text Sources
Other Literature Sources

