One at a time, live tracking of NGF axonal transport using quantum dots
- PMID: 17698956
- PMCID: PMC1959439
- DOI: 10.1073/pnas.0706192104
One at a time, live tracking of NGF axonal transport using quantum dots
Abstract
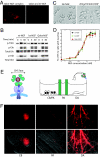
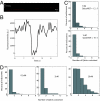
Retrograde axonal transport of nerve growth factor (NGF) signals is critical for the survival, differentiation, and maintenance of peripheral sympathetic and sensory neurons and basal forebrain cholinergic neurons. However, the mechanisms by which the NGF signal is propagated from the axon terminal to the cell body are yet to be fully elucidated. To gain insight into the mechanisms, we used quantum dot-labeled NGF (QD-NGF) to track the movement of NGF in real time in compartmentalized culture of rat dorsal root ganglion (DRG) neurons. Our studies showed that active transport of NGF within the axons was characterized by rapid, unidirectional movements interrupted by frequent pauses. Almost all movements were retrograde, but short-distance anterograde movements were occasionally observed. Surprisingly, quantitative analysis at the single molecule level demonstrated that the majority of NGF-containing endosomes contained only a single NGF dimer. Electron microscopic analysis of axonal vesicles carrying QD-NGF confirmed this finding. The majority of QD-NGF was found to localize in vesicles 50-150 nm in diameter with a single lumen and no visible intralumenal membranous components. Our findings point to the possibility that a single NGF dimer is sufficient to sustain signaling during retrograde axonal transport to the cell body.
Conflict of interest statement
The authors declare no conflict of interest.
Figures


Similar articles
-
A nerve growth factor-induced retrograde survival signal mediated by mechanisms downstream of TrkA.Neuropharmacology. 2007 Feb;52(2):270-8. doi: 10.1016/j.neuropharm.2006.07.032. Epub 2006 Sep 1. Neuropharmacology. 2007. PMID: 16949623
-
NGF signaling in sensory neurons: evidence that early endosomes carry NGF retrograde signals.Neuron. 2003 Jul 3;39(1):69-84. doi: 10.1016/s0896-6273(03)00397-0. Neuron. 2003. PMID: 12848933
-
A retrograde apoptotic signal originating in NGF-deprived distal axons of rat sympathetic neurons in compartmented cultures.Cell Res. 2009 May;19(5):546-60. doi: 10.1038/cr.2009.11. Cell Res. 2009. PMID: 19188931
-
Biogenesis and function of the NGF/TrkA signaling endosome.Int Rev Cell Mol Biol. 2015;314:239-57. doi: 10.1016/bs.ircmb.2014.10.002. Epub 2014 Nov 18. Int Rev Cell Mol Biol. 2015. PMID: 25619719 Free PMC article. Review.
-
Retrograde transport of neurotrophins: fact and function.J Neurobiol. 2004 Feb 5;58(2):217-29. doi: 10.1002/neu.10322. J Neurobiol. 2004. PMID: 14704954 Review.
Cited by
-
Single cell optical imaging and spectroscopy.Chem Rev. 2013 Apr 10;113(4):2469-527. doi: 10.1021/cr300336e. Epub 2013 Feb 14. Chem Rev. 2013. PMID: 23410134 Free PMC article. Review. No abstract available.
-
The Rab5-Rab11 Endosomal Pathway is Required for BDNF-Induced CREB Transcriptional Regulation in Hippocampal Neurons.J Neurosci. 2020 Oct 14;40(42):8042-8054. doi: 10.1523/JNEUROSCI.2063-19.2020. Epub 2020 Sep 14. J Neurosci. 2020. PMID: 32928890 Free PMC article.
-
Limited trafficking of a neurotropic virus through inefficient retrograde axonal transport and the type I interferon response.PLoS Pathog. 2010 Mar 5;6(3):e1000791. doi: 10.1371/journal.ppat.1000791. PLoS Pathog. 2010. PMID: 20221252 Free PMC article.
-
Morphometric and computational assessments to evaluate neuron survival and maturation within compartmentalized microfluidic devices: The influence of design variation on diffusion-driven nutrient transport.Neurosci Lett. 2019 Jun 11;703:58-67. doi: 10.1016/j.neulet.2019.03.025. Epub 2019 Mar 15. Neurosci Lett. 2019. PMID: 30885631 Free PMC article.
-
High accuracy 3D quantum dot tracking with multifocal plane microscopy for the study of fast intracellular dynamics in live cells.Biophys J. 2008 Dec 15;95(12):6025-43. doi: 10.1529/biophysj.108.140392. Epub 2008 Oct 3. Biophys J. 2008. PMID: 18835896 Free PMC article.
References
-
- Sofroniew MV, Howe CL, Mobley WC. Annu Rev Neurosci. 2001;24:1217–1281. - PubMed
-
- Miller FD, Kaplan DR. Science. 2002;295:1471–1473. - PubMed
-
- Ginty DD, Segal RA. Curr Opin Neurobiol. 2002;12:268–274. - PubMed
-
- Beattie EC, Zhou J, Grimes ML, Bunnett NW, Howe CL, Mobley WC. Cold Spring Harbor Symp Quant Biol. 1996;61:389–406. - PubMed
Publication types
MeSH terms
Substances
Grants and funding
LinkOut - more resources
Full Text Sources
Other Literature Sources

