. 2007 Sep 3;204(9):2075-87.
doi: 10.1084/jem.20070204. Epub 2007 Aug 13.

Memory CD8+ T cells mediate antibacterial immunity via CCL3 activation of TNF/ROI+ phagocytes

Affiliations

Memory CD8+ T cells mediate antibacterial immunity via CCL3 activation of TNF/ROI+ phagocytes

Emilie Narni-Mancinelli et al. J Exp Med. .

Abstract

Cytolysis, interferon gamma and tumor necrosis factor (TNF) alpha secretion are major effector mechanisms of memory CD8+ T cells that are believed to be required for immunological protection in vivo. By using mutants of the intracellular bacterium Listeria monocytogenes, we found that none of these effector activities is sufficient to protect against secondary infection with wild-type (WT) bacteria. We demonstrated that CCL3 derived from reactivated memory CD8+ T cells is required for efficient killing of WT bacteria. CCL3 induces a rapid TNF-alpha secretion by innate inflammatory mononuclear phagocytic cells (MPCs), which further promotes the production of radical oxygen intermediates (ROIs) by both MPCs and neutrophils. ROI generation is the final bactericidal mechanism involved in L. monocytogenes clearance. These results therefore uncover two levels of regulation of the antibacterial secondary protective response: (a) an antigen-dependent phase in which memory CD8+ T cells are reactivated and control the activation of the innate immune system, and (b) an antigen-independent phase in which the MPCs coordinate innate immunity and promote the bactericidal effector activities. In this context, CCL3-secreting memory CD8+ T cells are able to mediate "bystander" killing of an unrelated pathogen upon antigen-specific reactivation, a mechanism that may be important for the design of therapeutic vaccines.


Figures

Figure 1.
Figure 1.
The secA2 mutant does not induce long-term protective immunity. BALB/c mice (five per group) were injected with PBS or immunized with 109 HKLM or 0.1 × LD50 of the indicated bacteria (WT, 3 × 10³; llo , 5 × 10⁸; secA2 and actA , 106). Mice were secondary challenged with 3 × 10⁵ WT bacteria 1 mo later and killed at the indicated times after the infection. Data show the number of bacteria (mean ± SD) in the spleen (empty bars) and liver (filled bars) in a pool of three replicate experiments. p-values were calculated between groups of mice immunized with secA2 versus actA bacteria (with n = 9 mice).
Figure 2.
Figure 2.
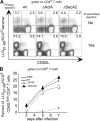
Analysis of primary and secondary CD8+ T cell responses in mice immunized with secA2, actA, or WT L. monocytogenes. BALB/c mice were immunized with PBS or 0.1 × LD50 of the indicated bacteria. (A) Mice (three per group) were either killed 8 d after the first immunization (top, primary) or challenged with 3 × 10⁵ WT bacteria 30 d later and co-treated with 25 mg ampicillin and killed after 5 d (bottom, secondary). Spleen cells were analyzed by FACS upon staining with H2-Kd/LLO91-99 tetramers, anti-CD62L, and anti-CD8 mAbs. Data show representative FACS dot plots after gating on CD8+ T cells in one out of three experiments. The frequency of cells in each upper quadrant is indicated. (B) Mice (three per group) primary immunized with PBS, secA2 , actA , or WT bacteria were secondary challenged with 3 × 10⁵ WT bacteria 30 d later, treated with ampicillin as above, and killed at the indicated times. Spleen cells were analyzed by FACS as described in A. Data show the frequencies (mean ± SE) of CD62Llow H2-Kd/LLO91-99 tetramer+ cells among CD8+ T lymphocytes in a representative (out of three) experiment.
Figure 3.
Figure 3.
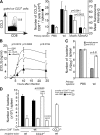
Cytolytic and IFN-γ–/TNF-α–secreting activities of CD8+ T cells in mice primary immunized with WT and mutants of L. monocytogenes. BALB/c mice (five per group) primarily immunized with PBS or 0.1 × LD50 of the indicated bacteria (PBS, secA2 , actA , or WT) were secondary challenged 30 d later with either PBS, 3 × 10⁵, or 104 (A, bottom) WT bacteria. (A) 3 h (top) or 4 d (bottom) after secondary challenge, animals were transferred with 107 CFSElow unpulsed and CFSEhigh LLO91-99 peptide–pulsed target cells. Spleen cells from individual mice were analyzed by FACS 15 h later. Data show representative FACS histograms in one out of three experiments. The numbers indicate the percentage of specific lysis of peptide-pulsed CFSEhigh cells. (B) At specified times, spleen cells from individual mice (three per group) were restimulated in vitro with LLO91-99 and analyzed by FACS for intracellular staining of IFN-γ and TNF-α. Data show the total numbers (mean ± SE) of IFN-γ– (left) and TNF-α– (right) secreting CD8+CD3+ T cells per spleen in a representative (out of three) experiment.
Figure 4.
Figure 4.
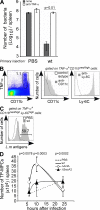
CCL3 from CD8+ T cells is required for secondary protective immunity. BALB/c mice primarily immunized with PBS or 0.1 × LD50 of the indicated bacteria (PBS, secA2 , actA , or WT) were secondary challenged 30 d later with WT bacteria. (A and B) At the indicated times, spleen cells from individual mice were restimulated in vitro with LLO91-99 peptide. (A, left) Data show a representative FACS profile of intracellular CCL3 staining after gating on CD3+ T cells. The total numbers (filled bars) and the mean fluorescence intensity (empty bars) (mean ± SD) of CCL3-secreting CD8+CD3+ T cells per spleen were shown 6 h after challenge (right). (B) Data show the concentration of CCL3 (mean ± SD) measured by ELISA in the supernatant of restimulated cells. (A and B) Data result from the pool of three replicate experiments. p-values were calculated between groups of mice immunized with secA2 versus actA bacteria (with n = 7 mice). (C) Mice (three per group) primary immunized with PBS or WT bacteria were treated with anti-CCL3 or normal goat IgG control and secondary challenged. Data show the number of bacteria (mean ± SE) in the spleen 2 d later in a representative (out of two) experiment. p-value was estimated accordingly to the rules of SE bars in the experiment shown (reference 54). (D) PBS-injected or primary immunized WT or CCL3−/− mice (8–12 per group) were secondary challenged. Purified CD8+ T cells were transferred into CCL3−/− or WT mice. Recipient animals were further treated with anti-CCL3 or control serum and challenged. Data show bacteria titers (mean ± SD) in the spleen 2 d later and result from the pool of three replicate experiments (n = 7). p-values are indicated.
Figure 5.
Figure 5.
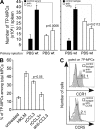
MPCs produce TNF-α during secondary protective response. (A) BALB/c mice (two per group) primary immunized with PBS or 0.1 × LD50 of WT bacteria were treated 30 d later with the soluble p75 TNF-α receptor (Enbrel) and secondary challenged with 3 × 10⁵ WT bacteria. Data show the number of bacteria (mean ± SE) in the spleen 2 d later in a representative (out of three) experiment. p-value was estimated accordingly to the rules of SE bars in the experiment shown (54). (B) Mice (two per group) were primary immunized and secondary challenged with WT bacteria (B and C) or PBS (C). 10 h later, spleen cells from individual mice were restimulated with HKLM (B) or not (C) and analyzed by FACS for surface staining of CD11b, Ly-6C, CD11c, and control isotype and for intracellular staining of L. monocytogenes–derived antigens and TNF-α. Data show representative FACS histograms after gating on the indicated cell population in a representative (out of three) experiment. (D) Mice primarily immunized with PBS, secA2 , actA , or WT bacteria were secondary challenged. At the indicated times, spleen cells from individual mice were restimulated with HKLM and analyzed by FACS for surface CD11b, Ly-6C, and intracellular TNF-α. The number (mean ± SD) of TNF-α–producing CD11bmed/highLy6Chigh mononuclear phagocytic cells (TP-MPCs) per spleen is indicated and result from the pool of three replicate experiments (n = 9). The p-values between the numbers of TP-MPCs in secA2 - versus actA -infected mice are indicated.
Figure 6.
Figure 6.
CCL3 promotes TNF-α secretion by MPCs. (A) Mice primary immunized with PBS or 0.1 × LD50 of WT bacteria were treated or not 30 d later with the indicated blocking (anti-CCL3), depleting (anti-CD8β), or control antibodies. 10 h after secondary challenge with 3 × 10⁵ WT bacteria, spleen cells from individual mice were restimulated with HKLM and analyzed by FACS for surface expression of CD11b, Ly-6C, and intracellular TNF-α. Data show the number (mean ± SD) of TP-MPCs per spleen and result from the pool of two to three replicate experiments (n = 7). p-values are indicated. (B and C) Mice were infected with 3 × 10⁵ WT bacteria and killed 24 h later. (B) Spleen cells from individual mice (five per group) were pooled, and flow-sorted MPCs were incubated in vitro with or without HKLM or with 1 μg/ml of recombinant CCL3 (endotoxin <1.2 pg/ml) with or without 10 μg/ml anti-CCL3 serum. Cells were analyzed by FACS for intracellular TNF-α. Data show the frequency of TNF-α–secreting cells among MPCs (± SE) and result from the pool of three experiments. p-value was estimated accordingly to the rules of SE bars from the pool of the three experiments (54). (C) Spleen cells from individual mice (two per group) were analyzed for intracellular TNF-α and surface expression of CD11b, Ly-6C, CCR1 (filled histograms), and CCR5 (filled histograms) or isotype control (empty histograms). Data show representative FACS profiles of CCR1 (left) and CCR5 (right) expression after gating on TP-MPCs in a representative (out of two) experiment.
Figure 7.
Figure 7.
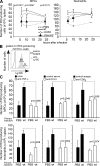
ROI production is induced by TNF-α during secondary response. (A and B) Mice primary immunized with (A) PBS or 0.1 × LD50 of secA2 , actA , or (A and B) WT bacteria were challenged 30 d later with 3 × 10⁵ WT bacteria. At the indicated times (A) or at 10 h (B) after secondary challenge, spleen cells from individual mice were restimulated with HKLM in the presence of hydroethidine. Cells were analyzed by FACS after staining with anti-CD11b and anti–Ly-6C mAbs. (A) Data show the number (mean ± SD) of ROI-producing MPCs (left) and neutrophils (right) per spleen. (B) Data show a representative histogram on Ly-6C (gray) or control isotype (empty) after gating on ROI-producing cells. Numbers indicate the frequency of MPCs (CD11bmed/highLy6Chigh) and neutrophils (CD11bhighLy6Cmed) in the indicated gate. (C) Mice primary immunized with PBS or WT bacteria were treated or not 30 d later with the indicated antibodies or sera. 10 h after secondary challenge, spleen cells from individual mice were treated and analyzed as above. Data show the number (mean ± SD) of ROI-producing MPCs (top) and neutrophils (bottom) per spleen. (A and C) Data result from the pool of two to three replicate experiments. p-values are indicated. A, n = 7; C, right and left panels, n = 7; C, middle panel, n = 9.
Figure 8.
Figure 8.
CCL3-producing memory CD8+ T cells promote ROI generation by phagocytic cells for secondary bacterial clearance. Indicated mice (three per group) were primary immunized with PBS (filled bars) or 3 × 10³ WT bacteria (empty bars). When specified, p47phox−/− mice were reconstituted 1 mo later with 4 × 10⁵ MPCs or 4 × 10⁶ neutrophils purified from WT or p47phox−/− mice. Mice were then treated or not with anti-CCL3 or anti-CD8β (right) and secondary challenged with 3 × 10⁵ bacteria. Mice were killed 2 d later, and the number of bacteria in the liver (mean ± SE) was measured. Data are representative of one out of two to three experiments. p-values were estimated accordingly to the SE bars rules in the experiment shown (54).
Figure 9.
Figure 9.
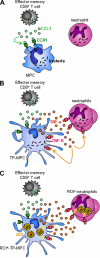
Schematic representation of memory CD8+ T cell–mediated antibacterial immunity. The cartoon shows (A) release of CCL3 by secondary effector CD8+ T cells, binding of CCL3 to its receptor CCR1 at the surface of MPC that results in MPC activation, (B) secretion of TNF-α by MPCs that leads to neutrophil and MPC activation, and (C) TNF-α–induced production of ROIs by neutrophils and MPCs, and subsequent bacteria killing.
Figure 10.
Figure 10.
CCL3 from secondary effector CD8+ T cells mediate bystander killing in vivo. BALB/c mice (three per group) primarily immunized with 0.1 × LD50 of WT L. monocytogenes (Lm) or control PBS were infected i.v. 3 wk later with the intracellular parasite L. major (2 × 10⁶/mouse). 2 wk later, mice were treated or not with anti-CCL3 serum and injected with 3 × 10⁵ WT Lm, 2 × 10⁷ LPS-matured splenic DCs pulsed with the Lm-derived LLO91-99 dominant epitope, or PBS (control). Spleens were harvested 2 d later, and cells were incubated in L. major growth medium (M199). (A) Schematic representation of the experimental protocol. (B) The number of live parasites per well (± SD) was determined after 4 d of culture. Data show the results of the pool of two replicate experiments (with n = 6 mice). p-value is indicated.

Similar articles

Cited by

References

    1. Harty, J.T., A.R. Tvinnereim, and D.W. White. 2000. CD8+ T cell effector mechanisms in resistance to infection. Annu. Rev. Immunol. 18:275–308. - PubMed
    1. Lauvau, G., S. Vijh, P. Kong, T. Horng, K. Kerksiek, N. Serbina, R.A. Tuma, and E.G.P. Am. 2001. Priming of memory but not effector CD8 T cells by a killed bacterial vaccine. Science. 294:1735–1739. - PubMed
    1. Mielke, M.E., G. Niedobitek, H. Stein, and H. Hahn. 1989. Acquired resistance to Listeria monocytogenes is mediated by Lyt-2+ T cells independently of the influx of monocytes into granulomatous lesions. J. Exp. Med. 170:589–594. - PMC - PubMed
    1. Badovinac, V.P., and J.T. Harty. 2000. Adaptive immunity and enhanced CD8+ T cell response to Listeria monocytogenes in the absence of perforin and IFN-gamma. J. Immunol. 164:6444–6452. - PubMed
    1. Badovinac, V.P., A.R. Tvinnereim, and J.T. Harty. 2000. Regulation of antigen-specific CD8+ T cell homeostasis by perforin and interferon-gamma. Science. 290:1354–1358. - PubMed

Publication types

MeSH terms