An "Electronic Fluorescent Pictograph" browser for exploring and analyzing large-scale biological data sets
- PMID: 17684564
- PMCID: PMC1934936
- DOI: 10.1371/journal.pone.0000718
An "Electronic Fluorescent Pictograph" browser for exploring and analyzing large-scale biological data sets
Abstract
Background: The exploration of microarray data and data from other high-throughput projects for hypothesis generation has become a vital aspect of post-genomic research. For the non-bioinformatics specialist, however, many of the currently available tools provide overwhelming amounts of data that are presented in a non-intuitive way.
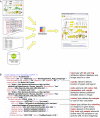
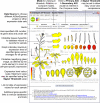
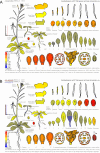
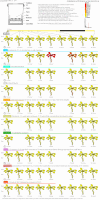
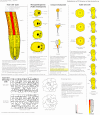
Methodology/principal findings: In order to facilitate the interpretation and analysis of microarray data and data from other large-scale data sets, we have developed a tool, which we have dubbed the electronic Fluorescent Pictograph - or eFP - Browser, available at http://www.bar.utoronto.ca/, for exploring microarray and other data for hypothesis generation. This eFP Browser engine paints data from large-scale data sets onto pictographic representations of the experimental samples used to generate the data sets. We give examples of using the tool to present Arabidopsis gene expression data from the AtGenExpress Consortium (Arabidopsis eFP Browser), data for subcellular localization of Arabidopsis proteins (Cell eFP Browser), and mouse tissue atlas microarray data (Mouse eFP Browser).
Conclusions/significance: The eFP Browser software is easily adaptable to microarray or other large-scale data sets from any organism and thus should prove useful to a wide community for visualizing and interpreting these data sets for hypothesis generation.
Conflict of interest statement
Figures


Similar articles
-
An 'eFP-Seq Browser' for visualizing and exploring RNA sequencing data.Plant J. 2019 Nov;100(3):641-654. doi: 10.1111/tpj.14468. Epub 2019 Aug 23. Plant J. 2019. PMID: 31350781 Free PMC article.
-
Gene Expression Browser: large-scale and cross-experiment microarray data integration, management, search & visualization.BMC Bioinformatics. 2010 Aug 20;11:433. doi: 10.1186/1471-2105-11-433. BMC Bioinformatics. 2010. PMID: 20727159 Free PMC article.
-
A Human "eFP" Browser for Generating Gene Expression Anatograms.PLoS One. 2016 Mar 8;11(3):e0150982. doi: 10.1371/journal.pone.0150982. eCollection 2016. PLoS One. 2016. PMID: 26954504 Free PMC article.
-
UCSC genome browser: deep support for molecular biomedical research.Biotechnol Annu Rev. 2008;14:63-108. doi: 10.1016/S1387-2656(08)00003-3. Biotechnol Annu Rev. 2008. PMID: 18606360 Review.
-
The Pain Genes Database: An interactive web browser of pain-related transgenic knockout studies.Pain. 2007 Sep;131(1-2):3.e1-4. doi: 10.1016/j.pain.2007.04.041. Epub 2007 Jun 14. Pain. 2007. PMID: 17574758 Review.
Cited by
-
The Role of Ribosomal Protein S6 Kinases in Plant Homeostasis.Front Mol Biosci. 2021 Mar 10;8:636560. doi: 10.3389/fmolb.2021.636560. eCollection 2021. Front Mol Biosci. 2021. PMID: 33778006 Free PMC article. Review.
-
Reverse engineering: a key component of systems biology to unravel global abiotic stress cross-talk.Front Plant Sci. 2012 Dec 31;3:294. doi: 10.3389/fpls.2012.00294. eCollection 2012. Front Plant Sci. 2012. PMID: 23293646 Free PMC article.
-
Calcineurin B-Like Protein-Interacting Protein Kinase CIPK21 Regulates Osmotic and Salt Stress Responses in Arabidopsis.Plant Physiol. 2015 Sep;169(1):780-92. doi: 10.1104/pp.15.00623. Epub 2015 Jul 21. Plant Physiol. 2015. PMID: 26198257 Free PMC article.
-
Combinatorial Effects of Fatty Acid Elongase Enzymes on Nervonic Acid Production in Camelina sativa.PLoS One. 2015 Jun 29;10(6):e0131755. doi: 10.1371/journal.pone.0131755. eCollection 2015. PLoS One. 2015. PMID: 26121034 Free PMC article.
-
Oxidation of Monolignols by Members of the Berberine Bridge Enzyme Family Suggests a Role in Plant Cell Wall Metabolism.J Biol Chem. 2015 Jul 24;290(30):18770-81. doi: 10.1074/jbc.M115.659631. Epub 2015 Jun 2. J Biol Chem. 2015. PMID: 26037923 Free PMC article.
References
-
- Rocca-Serra P, Brazma A, Parkinson H, Sarkans U, Shojatalab M, et al. ArrayExpress: a public database of gene expression data at EBI. Current Res Biol. 2003;326:1075–1078. - PubMed
-
- Garcia-Hernandez M, Berardini TZ, Chen G, Crist D, Doyle A, et al. TAIR: a resource for integrated Arabidopsis data. Funct Integr Genomics. 2002;2:239–253. - PubMed
Publication types
MeSH terms
LinkOut - more resources
Full Text Sources
Other Literature Sources

