

beta-Catenin regulates excitatory postsynaptic strength at hippocampal synapses
- PMID: 17679699
- PMCID: PMC1948936
- DOI: 10.1073/pnas.0702334104
beta-Catenin regulates excitatory postsynaptic strength at hippocampal synapses
Abstract
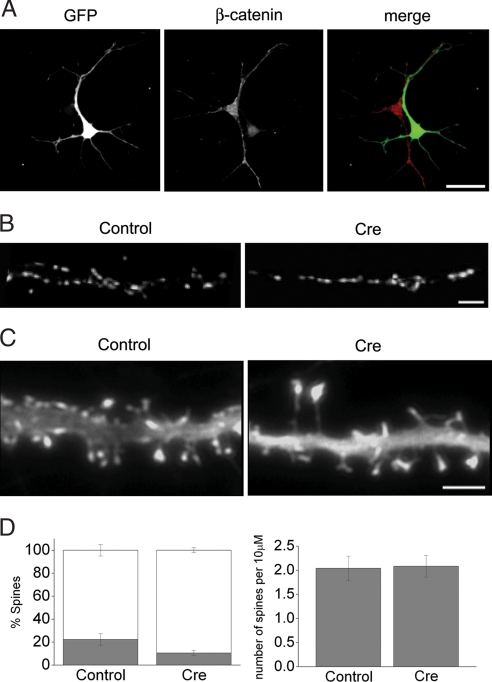
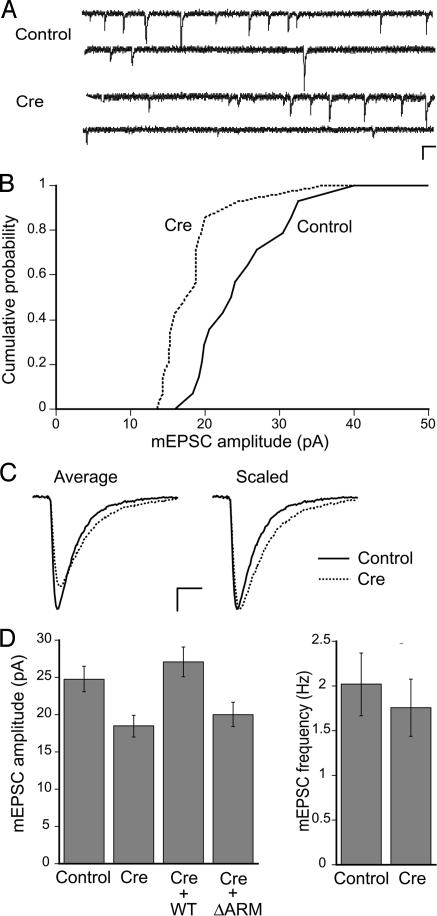
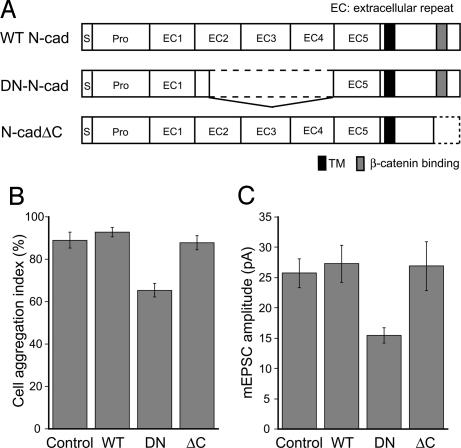
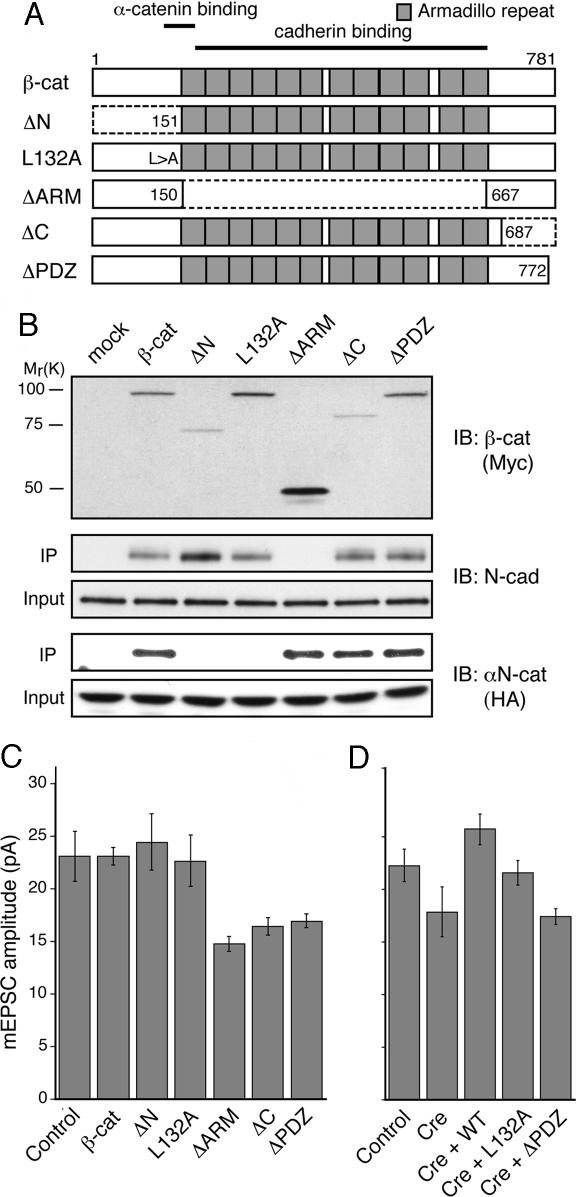
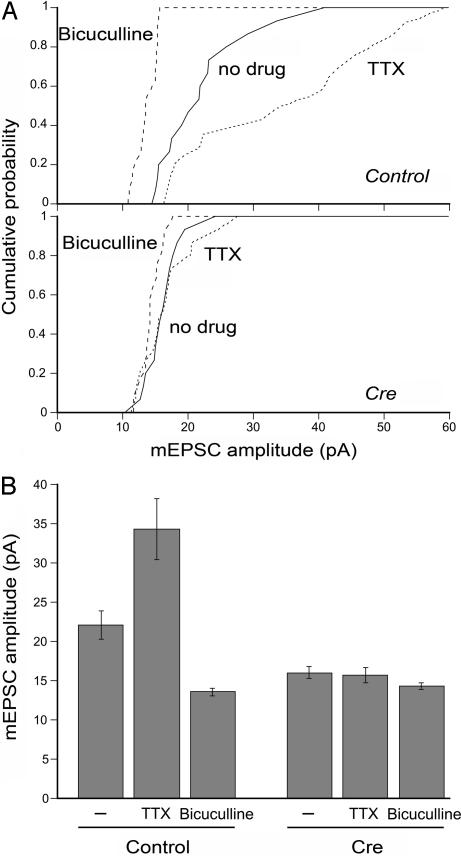
The precise contribution of the cadherin-beta-catenin synapse adhesion complex in the functional and structural changes associated with the pre- and postsynaptic terminals remains unclear. Here we report a requirement for endogenous beta-catenin in regulating synaptic strength and dendritic spine morphology in cultured hippocampal pyramidal neurons. Ablating beta-catenin after the initiation of synaptogenesis in the postsynaptic neuron reduces the amplitude of spontaneous excitatory synaptic responses without a concurrent change in their frequency and synapse density. The normal glutamatergic synaptic response is maintained by postsynaptic beta-catenin in a cadherin-dependent manner and requires the C-terminal PDZ-binding motif of beta-catenin but not the link to the actin cytoskeleton. In addition, ablating beta-catenin in postsynaptic neurons accompanies a block of bidirectional quantal scaling of glutamatergic responses induced by chronic activity manipulation. In older cultures at a time when neurons have abundant dendritic spines, neurons ablated for beta-catenin show thin, elongated spines and reduced proportion of mushroom spines without a change in spine density. Collectively, these findings suggest that the cadherin-beta-catenin complex is an integral component of synaptic strength regulation and plays a basic role in coupling synapse function and spine morphology.
Conflict of interest statement
The authors declare no conflict of interest.
Figures
Similar articles
-
The Adhesion-GPCR BAI1 Promotes Excitatory Synaptogenesis by Coordinating Bidirectional Trans-synaptic Signaling.J Neurosci. 2018 Sep 26;38(39):8388-8406. doi: 10.1523/JNEUROSCI.3461-17.2018. Epub 2018 Aug 17. J Neurosci. 2018. PMID: 30120207 Free PMC article.
-
A requirement for nuclear factor-kappaB in developmental and plasticity-associated synaptogenesis.J Neurosci. 2011 Apr 6;31(14):5414-25. doi: 10.1523/JNEUROSCI.2456-10.2011. J Neurosci. 2011. PMID: 21471377 Free PMC article.
-
N-cadherin regulates molecular organization of excitatory and inhibitory synaptic circuits in adult hippocampus in vivo.Hippocampus. 2014 Aug;24(8):943-962. doi: 10.1002/hipo.22282. Epub 2014 Apr 29. Hippocampus. 2014. PMID: 24753442 Free PMC article.
-
Kalirin-7 is a key player in the formation of excitatory synapses in hippocampal neurons.ScientificWorldJournal. 2010 Aug 17;10:1655-66. doi: 10.1100/tsw.2010.148. ScientificWorldJournal. 2010. PMID: 20730383 Free PMC article. Review.
-
Signaling between the actin cytoskeleton and the postsynaptic density of dendritic spines.Hippocampus. 2000;10(5):527-41. doi: 10.1002/1098-1063(2000)10:5<527::AID-HIPO3>3.0.CO;2-B. Hippocampus. 2000. PMID: 11075823 Review.
Cited by
-
AMPAR trafficking in synapse maturation and plasticity.Cell Mol Life Sci. 2013 Dec;70(23):4411-30. doi: 10.1007/s00018-013-1309-1. Epub 2013 Mar 9. Cell Mol Life Sci. 2013. PMID: 23475111 Free PMC article. Review.
-
Transsynaptic N-Cadherin Adhesion Complexes Control Presynaptic Vesicle and Bulk Endocytosis at Physiological Temperature.Front Cell Neurosci. 2021 Oct 7;15:713693. doi: 10.3389/fncel.2021.713693. eCollection 2021. Front Cell Neurosci. 2021. PMID: 34759800 Free PMC article.
-
Activity-Induced Regulation of Synaptic Strength through the Chromatin Reader L3mbtl1.Cell Rep. 2018 Jun 12;23(11):3209-3222. doi: 10.1016/j.celrep.2018.05.028. Cell Rep. 2018. PMID: 29898393 Free PMC article.
-
Pathophysiology of Trans-Synaptic Adhesion Molecules: Implications for Epilepsy.Front Cell Dev Biol. 2018 Sep 21;6:119. doi: 10.3389/fcell.2018.00119. eCollection 2018. Front Cell Dev Biol. 2018. PMID: 30298130 Free PMC article. Review.
-
Wnt/β-Catenin-Dependent Transcription in Autism Spectrum Disorders.Front Mol Neurosci. 2021 Nov 11;14:764756. doi: 10.3389/fnmol.2021.764756. eCollection 2021. Front Mol Neurosci. 2021. PMID: 34858139 Free PMC article. Review.
References
-
- Yuste R, Bonhoeffer T. Annu Rev Neurosci. 2001;24:1071–1089. - PubMed
-
- Dillon C, Goda Y. Annu Rev Neurosci. 2005;28:25–55. - PubMed
-
- Neuhoff H, Roeper J, Schweizer M. Eur J Neurosci. 1999;11:4241–4250. - PubMed
-
- Toni N, Buchs PA, Nikonenko I, Bron CR, Muller D. Nature. 1999;402:421–425. - PubMed
-
- De Paola V, Arber S, Caroni P. Nat Neurosci. 2003;6:491–500. - PubMed
Publication types
MeSH terms
Substances
Grants and funding
LinkOut - more resources
Full Text Sources
Molecular Biology Databases
